Waffle

Welcome to #30DayChartChallenge 2023 day 2

Networks
Published

April 2, 2023

Load the libraries

library(tidyverse)
── Attaching core tidyverse packages ──────────────────────── tidyverse 2.0.0 ──
✔ dplyr     1.1.2     ✔ readr     2.1.4
✔ forcats   1.0.0     ✔ stringr   1.5.0
✔ ggplot2   3.4.2     ✔ tibble    3.2.1
✔ lubridate 1.9.2     ✔ tidyr     1.3.0
✔ purrr     1.0.2     
── Conflicts ────────────────────────────────────────── tidyverse_conflicts() ──
✖ dplyr::filter() masks stats::filter()
✖ dplyr::lag()    masks stats::lag()
ℹ Use the conflicted package (<http://conflicted.r-lib.org/>) to force all conflicts to become errors
tuesdata <- tidytuesdayR::tt_load(2022, week = 52)
--- Compiling #TidyTuesday Information for 2022-12-27 ----
--- There are 2 files available ---
--- Starting Download ---

    Downloading file 1 of 2: `tlBooks.csv`
    Downloading file 2 of 2: `tlFootnotes.csv`
--- Download complete ---
tlBooks <- tuesdata$tlBooks
tlFootnotes<-tuesdata$tlFootnotes
tlBooks%>%names
 [1] "year"               "title"              "series"            
 [4] "anthology"          "format"             "number"            
 [7] "novelization"       "setting"            "stardate_start"    
[10] "stardate_end"       "detailed_date"      "section"           
[13] "primary_entry_year" "footnote"          
tlFootnotes%>%names
[1] "footnote" "text"    

Join the two sets by footnote

The new dataset combines, year, title, … with the footnote of the Star Trek Timelines. The data comes from the {rtrek} package by Georgios Karamanis.

df <- tlBooks %>%
  inner_join(tlFootnotes,by="footnote")

df%>%DataExplorer::profile_missing()%>%arrange(pct_missing)
# A tibble: 15 × 3
   feature            num_missing pct_missing
   <fct>                    <int>       <dbl>
 1 year                         0      0     
 2 title                        0      0     
 3 format                       0      0     
 4 novelization                 0      0     
 5 setting                      0      0     
 6 footnote                     0      0     
 7 text                         0      0     
 8 series                      28      0.0568
 9 section                    265      0.538 
10 number                     302      0.613 
11 anthology                  325      0.659 
12 primary_entry_year         367      0.744 
13 stardate_start             406      0.824 
14 detailed_date              425      0.862 
15 stardate_end               464      0.941 

How to make a Waffle

This is a little example from: https://r-charts.com/part-whole/waffle-chart-ggplot2/

# install.packages("waffle", repos = "https://cinc.rud.is")
library(waffle)

# Vector
x <- c(30, 25, 20, 5)

# Waffle chart
waffle(x, rows = 8)

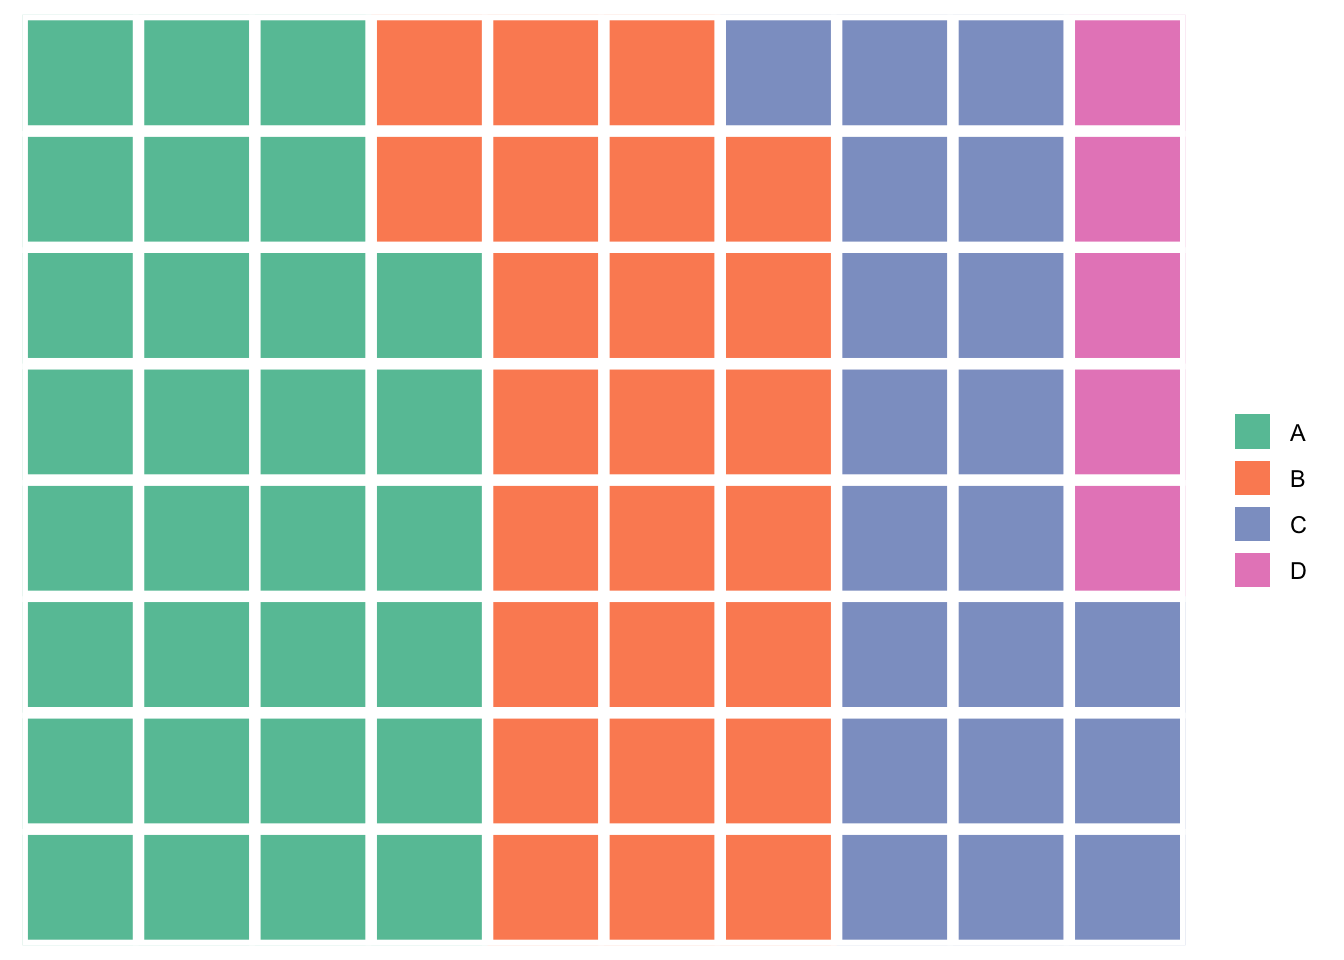
In this dataset there are three formats: book, episode and story
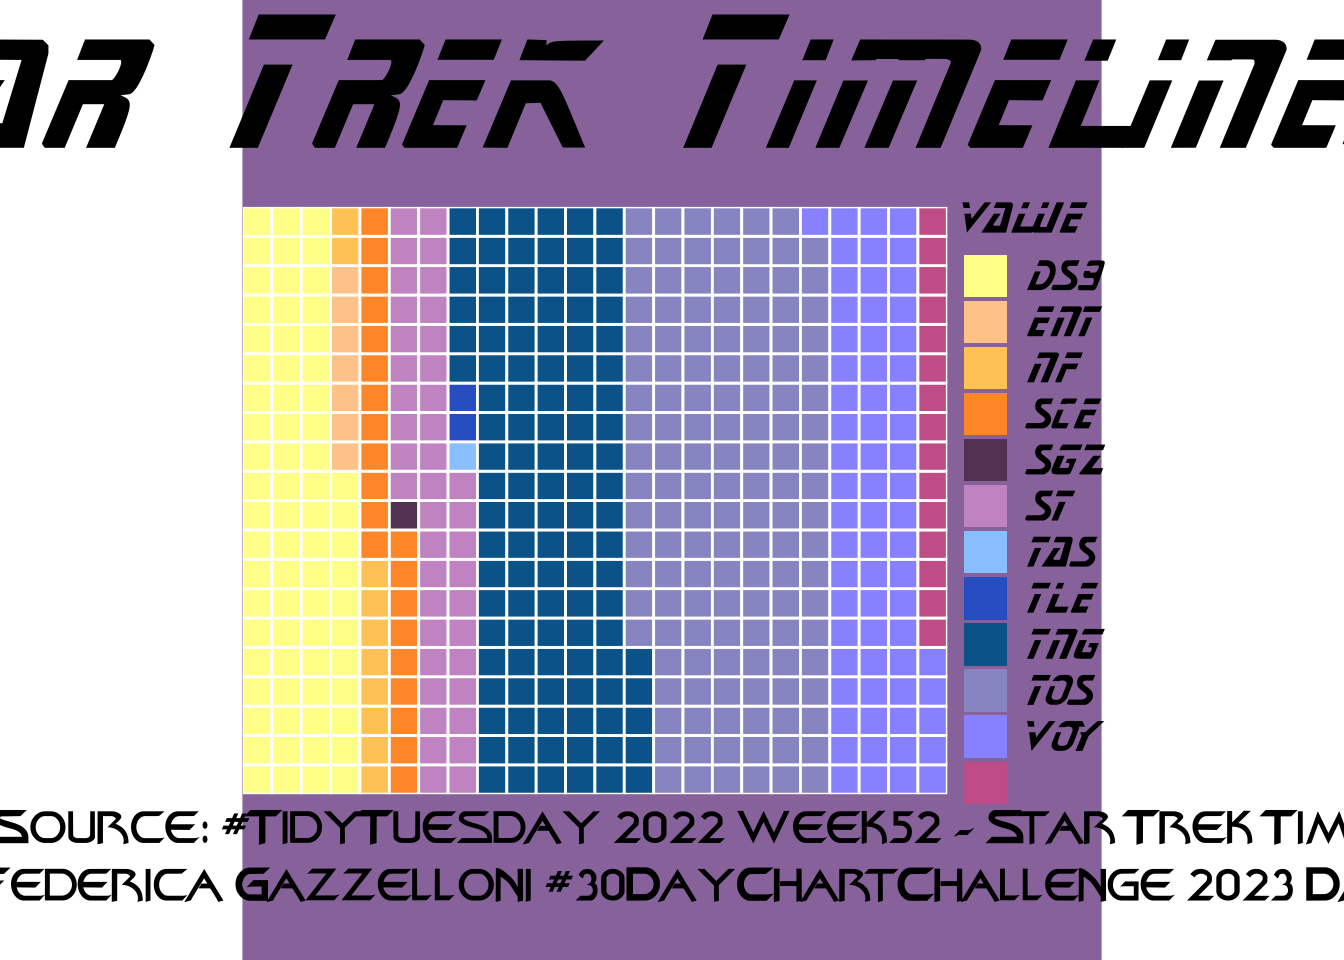
df%>%
  count(format)%>%
  waffle(rows=20)

Using ggplot2

This Waffle is made of 12 different colors for identifying the SSeries. Here are used many colors from the trekcolors package for coloring the series of different colors.

# install.packages("trekcolors")
library(trekcolors)
# trekcolors::lcars_colors()

The fonts are from the trekfont package.

# install.packages("trekfont")
library(trekfont)
# trekfont::show_trekfonts()
library(showtext)
Loading required package: sysfonts
Loading required package: showtextdb
font <- c("Khan", "StarNext", "FederationDS9Title", "Federation", "Klingon", "ModernVulcan", "TNGcast", "FederationStarfleet")
path <- system.file(paste0("fonts/", font, ".ttf"), package = "trekfont")
for(i in seq_along(font)) font_add(font[i], path[i])
font_families()
 [1] "sans"                "serif"               "mono"               
 [4] "wqy-microhei"        "Khan"                "StarNext"           
 [7] "FederationDS9Title"  "Federation"          "Klingon"            
[10] "ModernVulcan"        "TNGcast"             "FederationStarfleet"
showtext_auto(enable = TRUE)
library(waffle)
df%>%
  count(series)%>%
  drop_na()%>%
  waffle(rows = 20, size = 0.5)+
  scale_fill_manual(values =as.character(lcars_colors())) +
  # Waffle plot
  #ggplot(aes(fill = series, values = n)) +
  #geom_waffle(n_rows = 20, size = 0.5, colour = "white") +
  #scale_fill_manual(values =as.character(lcars_colors())) +
  coord_equal() +
  scale_x_continuous(expand = c(0, 0))+
  labs(title="Star Trek Timelines Series",
       subtitle = "",
       caption="DataSource: #TidyTuesday 2022 week52 - Star Trek Timelines\nDataViz: Federica Gazzelloni #30DayChartChallenge 2023 Day2 - Waffle\n")+
  theme_void()+
  theme(text = element_text(family= "StarNext",size=14),
        #legend.position = "bottom",
        plot.title = element_text(size=50,hjust = 0.3,vjust = 0),
        plot.caption = element_text(size=20,hjust = 0.4,family="FederationDS9Title"),
        panel.background = element_rect(fill="#9977AA",color="#9977AA"),
        plot.background = element_rect(fill="#9977AA",color="#9977AA"))
Scale for fill is already present.
Adding another scale for fill, which will replace the existing scale.
Coordinate system already present. Adding new coordinate system, which will
replace the existing one.
Scale for x is already present.
Adding another scale for x, which will replace the existing scale.

ggsave("ss.png",
       width = 6,height = 5.5,
       bg="#9977AA",
       dpi=200)