library(tidyverse)
library(cowplot)
library(sysfonts)
library(showtext)
sysfonts::font_add_google("Public Sans","Public Sans")
# font_add_google("Carter One", "Carter One")
showtext::showtext_auto()
showtext::showtext_opts(dpi=320)Overview
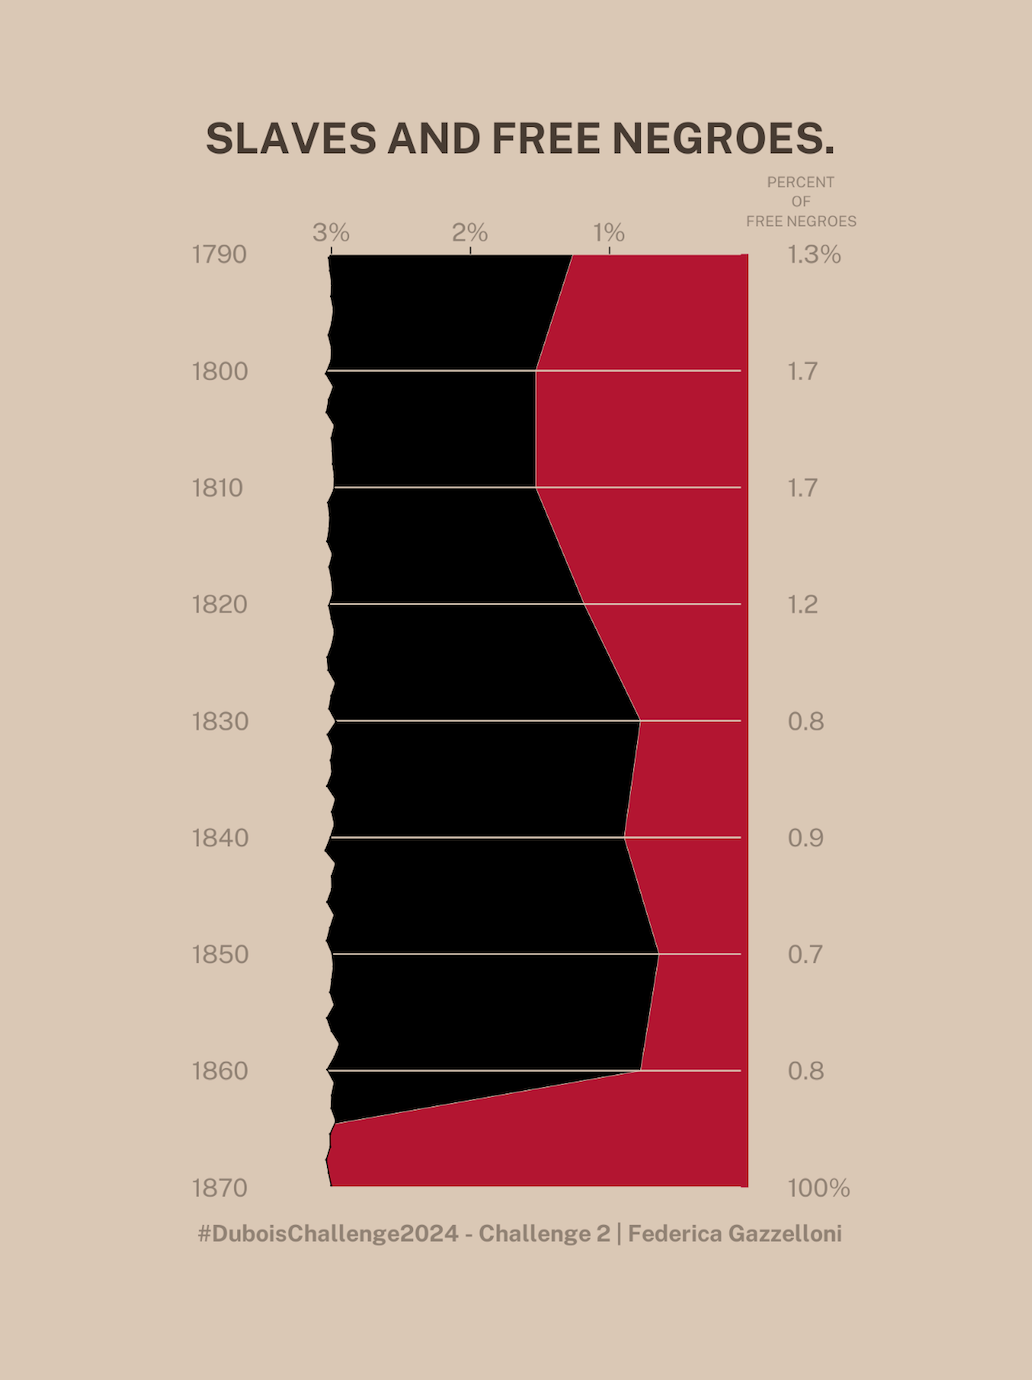
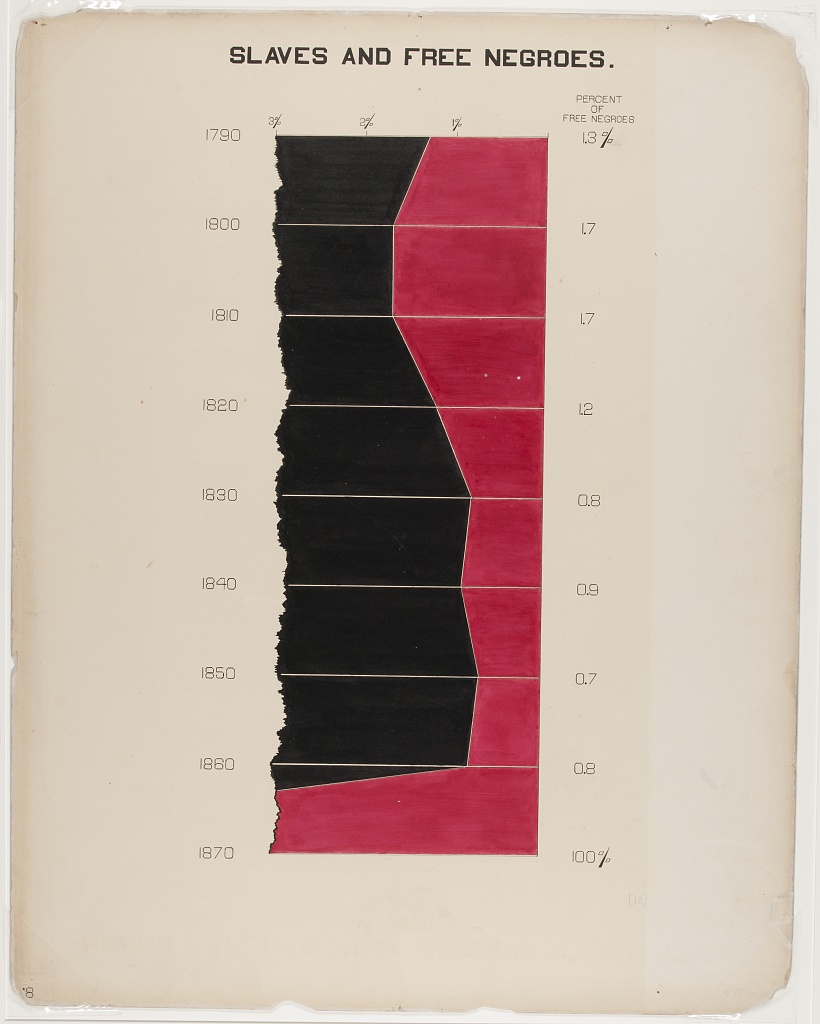
Slave and Free Negroes (plate 12), February 12
Load Libraries
Load Data
ch2 <- read.csv("https://raw.githubusercontent.com/ajstarks/dubois-data-portraits/master/challenge/2024/challenge02/data.csv")
ch2
ch2_1 <- ch2 %>%
arrange(Year)%>%
mutate(Year=as.factor(Year),
id=rev(row_number()))%>%
relocate(id)
ch2_1ch2_1%>%
# pivot_longer(cols = c("Slave","Free"))%>%
ggplot()+
geom_col(aes(y=factor(id),x=Slave),fill="black")+
geom_col(aes(y=factor(id),x=Free),fill="red")+
coord_cartesian(xlim = c(3,100))ch2_1%>%
#pivot_longer(cols = c("Slave","Free"))%>%
ggplot()+
geom_line(aes(x=factor(id),y=Slave,group=1),color="red")+
geom_line(aes(x=factor(id),y=Free,group=1),color="black")+
scale_y_reverse()+
coord_flip()ch2_1%>%
#pivot_longer(cols = c("Slave","Free"))%>%
ggplot()+
geom_area(aes(x=(id),y=Slave),fill="red")+
geom_area(aes(x=(id),y=Free),fill="black")+
scale_y_log10()+
coord_flip()ch2_1ch2_2 <- ch2_1%>%
mutate(Year=as.integer(Year))%>%
mutate(Free_ln=log(Free),
Slave_ln=log(Slave))
ch2_2ch2_2%>%
ggplot()+
geom_ribbon(mapping=aes(x=Year,y=log(Free),
ymin=pmax(log(Free), -1),
ymax=pmax(log(Free), 5)),
fill='black')+
geom_ribbon(mapping=aes(x=Year,y=log(Free),
ymin=pmin(log(Free), -1),
ymax=pmin(log(Free), 5)),
fill='#b5102d')+
geom_line(aes(x=Year,y=log(Free)),
linewidth=0.1,
color="white")+
geom_vline(aes(xintercept=Year),
color="white",
linewidth=0.1)+
scale_y_reverse()+
scale_x_reverse()+
coord_flip(xlim = c(9,1),ylim = c(2,-0.8))+
theme_void()+
theme(#plot.background = element_rect(fill="#d2394f"),
#panel.background = element_rect(fill="#d2394f"),
panel.grid = element_blank())ggsave("test.png",bg="#dbc8b4",
width = 3,height = 6)ch2_2length(rep(ch2_2$id,11))set.seed(000)
d <- tibble(x=rep(rnorm(90,mean=5,sd=20),each=10),
y=seq(1.9,2,0.0001112347) #1/98
)
# 0.2/(length(x)-1)
d%>%
ggplot()+
geom_line(aes(x=x,y=y))
coord_flip()ch2_2%>%
ggplot()+
geom_ribbon(mapping=aes(x=Year,y=log(Free),
ymin=pmax(log(Free), -1),
ymax=pmax(log(Free), 5)),
fill='black')+
geom_ribbon(mapping=aes(x=Year,y=log(Free),
ymin=pmin(log(Free), -1),
ymax=pmin(log(Free), 5)),
fill='#b5102d')+
geom_line(aes(x=Year,y=log(Free)),
linewidth=0.1,
color="white")+
geom_vline(aes(xintercept=Year),
color="white",
linewidth=0.1)+
geom_line(data=d,aes(x=x,y=y),color="#dbc8b4")+
geom_ribbon(data=d,mapping=aes(x,y=y,
ymin=pmax(y, -1),
ymax=pmax(y, 5)),
fill='#dbc8b4')+
scale_y_reverse()+
scale_x_reverse()+
coord_flip(xlim = c(9,1),ylim = c(2,-0.8))+
theme_void()+
theme(plot.background = element_rect(fill="#dbc8b4"),
panel.background = element_rect(fill="#dbc8b4"),
panel.grid = element_blank())ggsave("test1.png",bg="#dbc8b4",
width = 3,height = 6)ch2_2$Free_ln# Define the given numbers corresponding to decades
given_numbers <- ch2_2$Free_ln
# Function to simulate numbers within a decade
# Define the number of points to simulate within each decade
num_points_per_decade <- 10
# Initialize a vector to store the simulated numbers
simulated_numbers <- numeric()
# Simulate numbers within each decade
for (i in 1:9) {
start <- given_numbers[i]
end <- given_numbers[i + 1]
simulated_within_decade <- rnorm(num_points_per_decade, start, end)
simulated_numbers <- c(simulated_numbers, simulated_within_decade)
}
# Print the simulated numbers
print(simulated_numbers)set.seed(000)
d <- tibble(x=simulated_numbers,
y=seq(1.9,2,0.1/(length(x)-1)) #1/98
)
# 0.2/(length(x)-1)
d%>%
ggplot()+
geom_line(aes(x=x,y=y))
coord_flip()ch2_2$Free%>%mean;
ch2_2$Slave%>%meanset.seed(000)
d <- tibble(x=rep(rnorm(90,mean=5,sd=20),each=10),
y=seq(1.9,2,0.0001112347) #1/98
)
x=rep(rnorm(90,mean=5,sd=20),each=10)
y=seq(1.9,2,0.0001112347)
f <- approxfun(x, y)
# curve(f(x), 0, 11, col = "green2")
# points(x, y)
# 0.2/(length(x)-1)
d$x <- f(x)
ch2_2%>%
ggplot()+
geom_line(aes(x=Year,y=Free))+
geom_line(aes(x=Year,y=log(Free)))
coord_flip()tb <- approx(ch2_2$Free,ch2_2$Year,n=900)
d2 <- tibble(x=tb$x,y=rnorm(900,mean=2,sd=0.02))
d2%>%summary()
d2%>%ggplot()+geom_line(aes(x,y))years <- ch2_1$Yearch2_2%>%
ggplot()+
geom_ribbon(mapping=aes(x=Year,y=log(Free),
ymin=pmax(log(Free), -1),
ymax=pmax(log(Free), 5)),
fill='black')+
geom_ribbon(mapping=aes(x=Year,y=log(Free),
ymin=pmin(log(Free), -1),
ymax=pmin(log(Free), 5)),
fill='#b5102d')+
geom_line(aes(x=Year,y=log(Free)),
linewidth=0.1,
color="#dbc8b4")+
geom_vline(aes(xintercept=Year),
color="#dbc8b4",
linewidth=0.3)+
geom_ribbon(data=d2,mapping=aes(x=x,y=y,
ymin=pmax(y, -1),
ymax=pmax(y, 5)),
fill='#dbc8b4')+
geom_point(data=d2%>%filter(x>=1 & x <= 9),
aes(x=x,y=y),
color="black",
shape=".")+
geom_line(data=d2%>%filter(x>=1 & x <= 9),
aes(x=x,y=y),
color="black",linewidth=0.2)+
# adjust scales to a reverse position
scale_y_reverse(position = "right",
breaks = 0:2,
labels = paste0(c("1%", "2%", "3%"), ""))+
scale_x_reverse(name = "First Axis",
position = "top",
breaks = 1:9,
expand = expansion(add=-0.5),
labels = paste0(rev(c("100%", "0.8", "0.7","0.9","0.8","1.2","1.7","1.7","1.3%")), ""),
sec.axis = sec_axis(~.*1,
name="Second Axis",
breaks = 1:9,
labels =years))+
coord_flip(xlim = c(9.5,0.5),ylim = c(2.1,-0.8),
clip = "off")+
annotate("text", x = 0.55, y = -1.38,
label = "PERCENT\nOF\nFREE NEGROES",
size = 1.8,
color=alpha("#483c32",alpha = 0.5),
#fontface = "bold",
family = "Public Sans" ) +
labs(title = "SLAVES AND FREE NEGROES.\n",
caption = "\n#DuboisChallenge2024 - Challenge 2 | Federica Gazzelloni") +
theme(text=element_text(family="Public Sans",color="#483c32"),
plot.title = element_text(face="bold",hjust = 0.5,size=15,family="Public Sans",color="#483c32"),
plot.caption = element_text(face="bold",hjust = 0.5,size=8,
color=alpha("#483c32",alpha = 0.5)),
plot.background = element_rect(fill="#dbc8b4",color="#dbc8b4"),
panel.background = element_rect(fill="#dbc8b4",color="#dbc8b4"),
panel.grid = element_blank(),
axis.title = element_blank(),
axis.line.x = element_blank(),
axis.line.y = element_blank(),
axis.ticks.x.top = element_line(linewidth=0.2,color="black"),
axis.ticks.y.right = element_blank(),
axis.ticks.y.left = element_blank(),
axis.text = element_text(family = "Public Sans",color=alpha("#483c32",alpha = 0.5)),
axis.text.y.right = element_text(hjust=0,
margin = margin(15,15,15,15),family = "Public Sans"),
axis.text.y.left = element_text(hjust=0,
margin = margin(15,15,15,15),family = "Public Sans"))ggsave("test_approx.png",bg="#dbc8b4",
width = 4,height = 6)ggdraw()+
draw_image("test_approx.png",scale = 0.8)ggsave("challenge02.png",bg="#dbc8b4",
width = 4.5,height = 6)