library(tidyverse)
library(sysfonts)
library(showtext)
sysfonts::font_add_google("Public Sans","Public Sans")
# font_add_google("Carter One", "Carter One")
showtext::showtext_auto()
showtext::showtext_opts(dpi=320)Overview
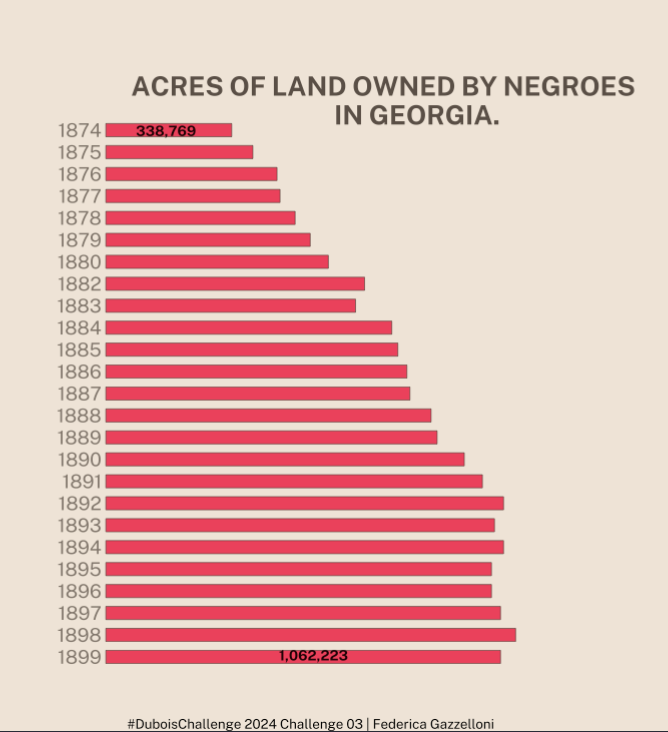
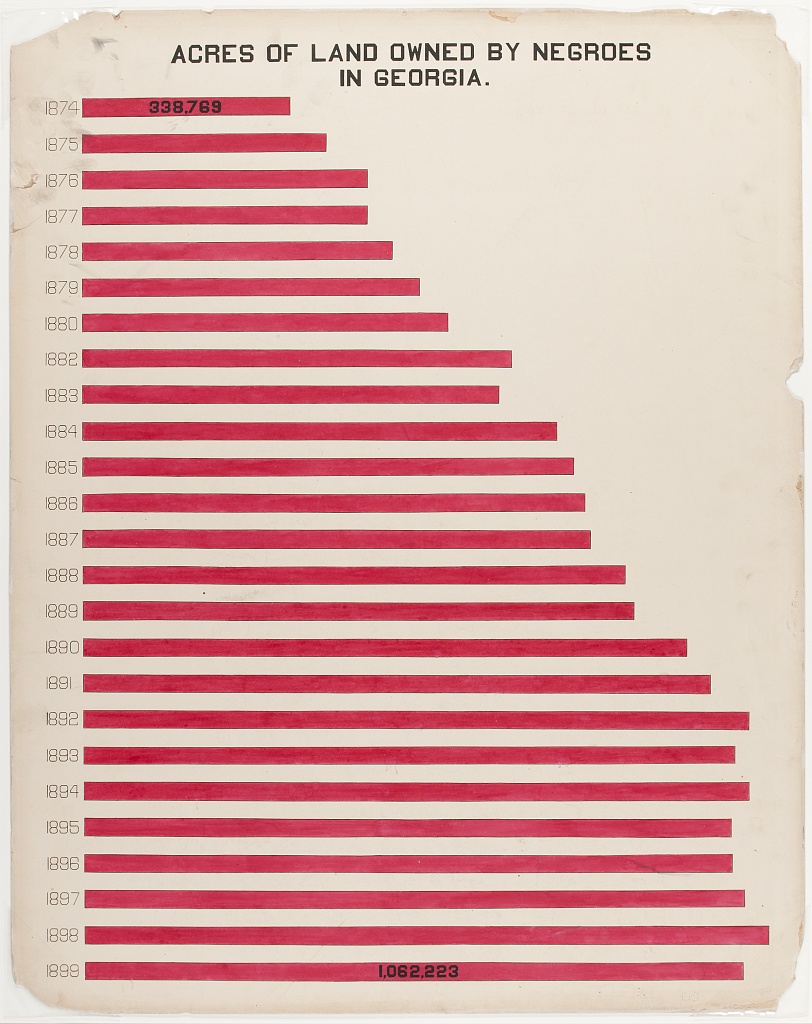
Acres of Land Owned by Negroes in Georgia (plate 19), February 19
data <- read.csv("https://raw.githubusercontent.com/ajstarks/dubois-data-portraits/master/challenge/2024/challenge03/data.csv")
data%>%dimdata$Date%>%typeof()data %>%
mutate(Date=as.factor(-Date))%>%
ggplot(aes(x=Land,y=factor(Date)))+
geom_col(width=0.6,
linewidth=0.1,
color=alpha("#483c32",alpha = 0.9),
fill="#ec3e58")+
geom_text(aes(x=0,y=factor(Date),label=(data$Date)),
family="Public Sans",
color=alpha("#483c32",alpha = 0.7),
hjust = 1.1,size=2)+
geom_text(data=data%>%filter(Date=="1874"),
aes(x=0,y=factor(Date)),
label="338,769",
color=alpha("black",alpha = 0.9),
family="Public Sans", fontface="bold",
hjust = -0.5,vjust=2.7,size=1.5)+
geom_text(data=data%>%filter(Date=="1899"),
aes(x=0,y=factor(Date)),
label="1,062,223",
color=alpha("black",alpha = 0.9),
family="Public Sans",fontface="bold",
hjust = -2.5,vjust=55.75,size=1.5)+
scale_y_discrete(labels=rev(data$Date),
expand =expansion(mult=0,add = 0))+
scale_x_continuous(expand =expansion(mult=1,add = 0))+
coord_cartesian(ylim = c(-1,29),clip = "off")+
labs(title="ACRES OF LAND OWNED BY NEGROES\nIN GEORGIA.",
caption="#DuboisChallenge 2024 Challenge 03 | Federica Gazzelloni")+
theme_void()+
theme(text=element_text(family="Public Sans"),
plot.title = element_text(family="Public Sans",
face="bold",
size=8,
color=alpha("#483c32",alpha = 0.9),
hjust = 0.6,vjust=-18),
plot.caption = element_text(hjust=0.5,size=4),
axis.ticks = element_blank(),
axis.text =element_blank(),
axis.title = element_blank(),
plot.background = element_rect(color="#eee3d5",fill="#eee3d5"),
panel.background = element_rect(color="#eee3d5",fill="#eee3d5")
)ggsave("challenge03.png")