# install.packages("tidyverse")
# remotes::install_github("coolbutuseless/ggpattern")Overview
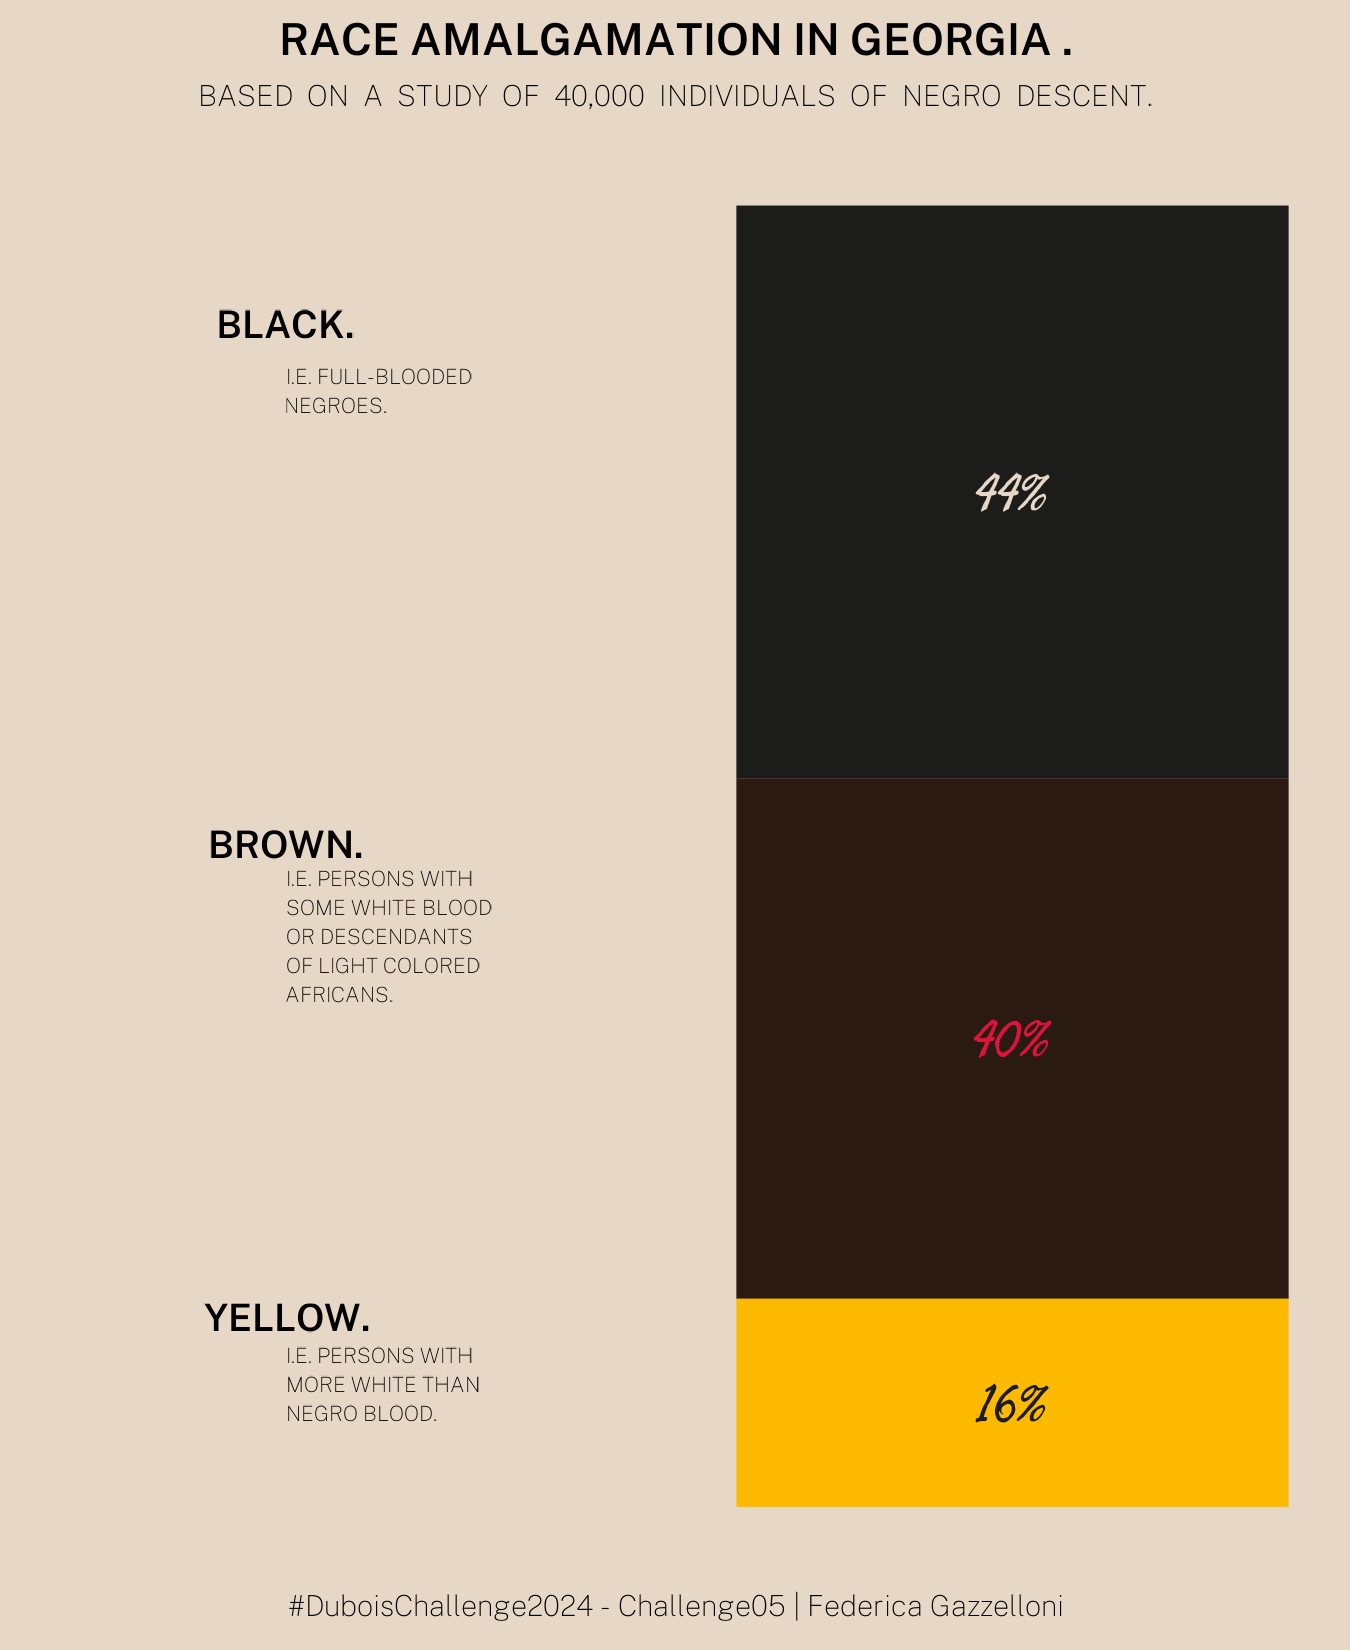
Race Amalgamation in Georgia (plate 13), March 4

Install Libraries
Load Libraries
suppressPackageStartupMessages({
  library(tidyverse)
  library(patchwork)
  library(sysfonts)
  library(showtext)
})
Load Data
url <- "https://raw.githubusercontent.com/ajstarks/dubois-data-portraits/master/challenge/2024/challenge05/data.csv"

dat <- read_csv("https://raw.githubusercontent.com/ajstarks/dubois-data-portraits/master/challenge/2024/challenge05/data.csv")
dat
Bar Plot
dat %>%
  ggplot(aes(x=Category,y=Percentage))+
  geom_col()
Staked Bar Plot
dat %>%
  ggplot(aes(x=1,y=Percentage,fill=Category))+
  geom_col(show.legend = F)
Dubois Style
colors_bar <- c("#1C1C1Bff","#2A1A12ff","#FDBA00ff")
colors_text <- c("#E6D7C6ff","#dc143c","#1C1C1Bff")sysfonts::font_add_google(name="Public Sans",
family = "Public Sans",
regular.wt = 100)
sysfonts::font_add_google(name="Public Sans",
family = "Public Sans-med",
regular.wt = 600)
sysfonts::font_add_google(name="Freehand",
family="Freehand")
showtext::showtext_auto()
showtext::showtext_opts(dpi=320)Stacked Bar Plot with Dubois’ style
dat %>%
  ggplot(aes(x=1,y=Percentage,fill=Category))+
  geom_col(show.legend = F)+
  scale_fill_manual(values = colors_bar)+
  geom_text(aes(label=Percentage))
Plot 1
plot1 <- dat %>%
  mutate(yy=c(Percentage[3]+Percentage[2]+Percentage[1]/2,
              Percentage[3]+Percentage[2]/2,
              Percentage[3]/2)) %>%
  ggplot(aes(x=1,y=Percentage,fill=Category))+
  geom_col(show.legend = F)+
  scale_fill_manual(values = colors_bar)+
  geom_text(aes(y=yy,label=paste0(Percentage,"%")),
            color=colors_text,
            family="Freehand")+
  xlim(0.5,1.5)
Text
text <- c("I.E. FULL-BLOODED\nNEGROES.",
          "I.E. PERSONS WITH\nSOME WHITE BLOOD\nOR DESCENDANTS\nOF LIGHT COLORED\nAFRICANS.",
          "I.E. PERSONS WITH\nMORE WHITE THAN\nNEGRO BLOOD.")
Text Plot
dat %>%
  mutate(text1=rev(cumsum(rev(Percentage))))%>%
  ggplot(aes(x=1,y=text1))+
  geom_text(aes(label=text))
Plot 2
plot2 <- dat %>%
  mutate(text1=rev(cumsum(rev(Percentage))))%>%
  ggplot(aes(x=1,y=text1))+
  geom_text(aes(label=c("BLACK.","BROWN.","YELLOW.")),
            family="Public Sans-med",
            size=3)+
  geom_text(aes(label=text),
          size=1.7,
          hjust=0,
          vjust=2*c(1,0.6,0.7),
          family="Public Sans")+
  ylim(0,110)+
  xlim(0.5,1.7)
Plot Layout
(plot2 + plot1) +
  patchwork::plot_layout(ncol = 2)
Full Visualization
(plot2 + plot1) +
  patchwork::plot_layout(ncol = 2) &
  plot_annotation(
    title="RACE AMALGAMATION IN GEORGIA .",
    subtitle = "BASED  ON  A  STUDY  OF  40,000  INDIVIDUALS  OF  NEGRO  DESCENT.\n",
    caption = "#DuboisChallenge2024 - Challenge05 | Federica Gazzelloni\n") &
  theme_void() &
  theme(plot.title = element_text(hjust=0.5,
                                  family="Public Sans-med",
                                  size=10),
        plot.subtitle = element_text(hjust=0.5,
                                     family="Public Sans",
                                     size=6.5),
        plot.caption = element_text(hjust=0.5,
                                    family="Public Sans",
                                    size=6.5))
Add a place holder
(plot2 + plot_spacer() + plot1) +
  patchwork::plot_layout(ncol = 3, widths = c(1,0,1)) &
  plot_annotation(
    title="RACE AMALGAMATION IN GEORGIA .",
    subtitle = "BASED  ON  A  STUDY  OF  40,000  INDIVIDUALS  OF  NEGRO  DESCENT.\n",
    caption = "#DuboisChallenge2024 - Challenge05 | Federica Gazzelloni\n") &
  theme_void() &
  theme(plot.title = element_text(hjust=0.5,
                                  family="Public Sans-med",
                                  size=10),
        plot.subtitle = element_text(hjust=0.5,
                                     family="Public Sans",
                                     size=6.5),
        plot.caption = element_text(hjust=0.5,
                                    family="Public Sans",
                                    size=6.5))
Save it!
ggsave(filename = "your_challenge05.png",
       bg="#E6D7C6ff",
       height=5.5, width=4.5, unit="in")