Dataviz lunch:
Replicating Du Bois with R
Who am I?
My name is Federica Gazzelloni. I am an independent researcher involved in a couple of interesting projects about health sciences. I am passionate about actuarial statistics, also love to be part of the book club facilitators’ team with the R4DS online community learning.

Impact on Society
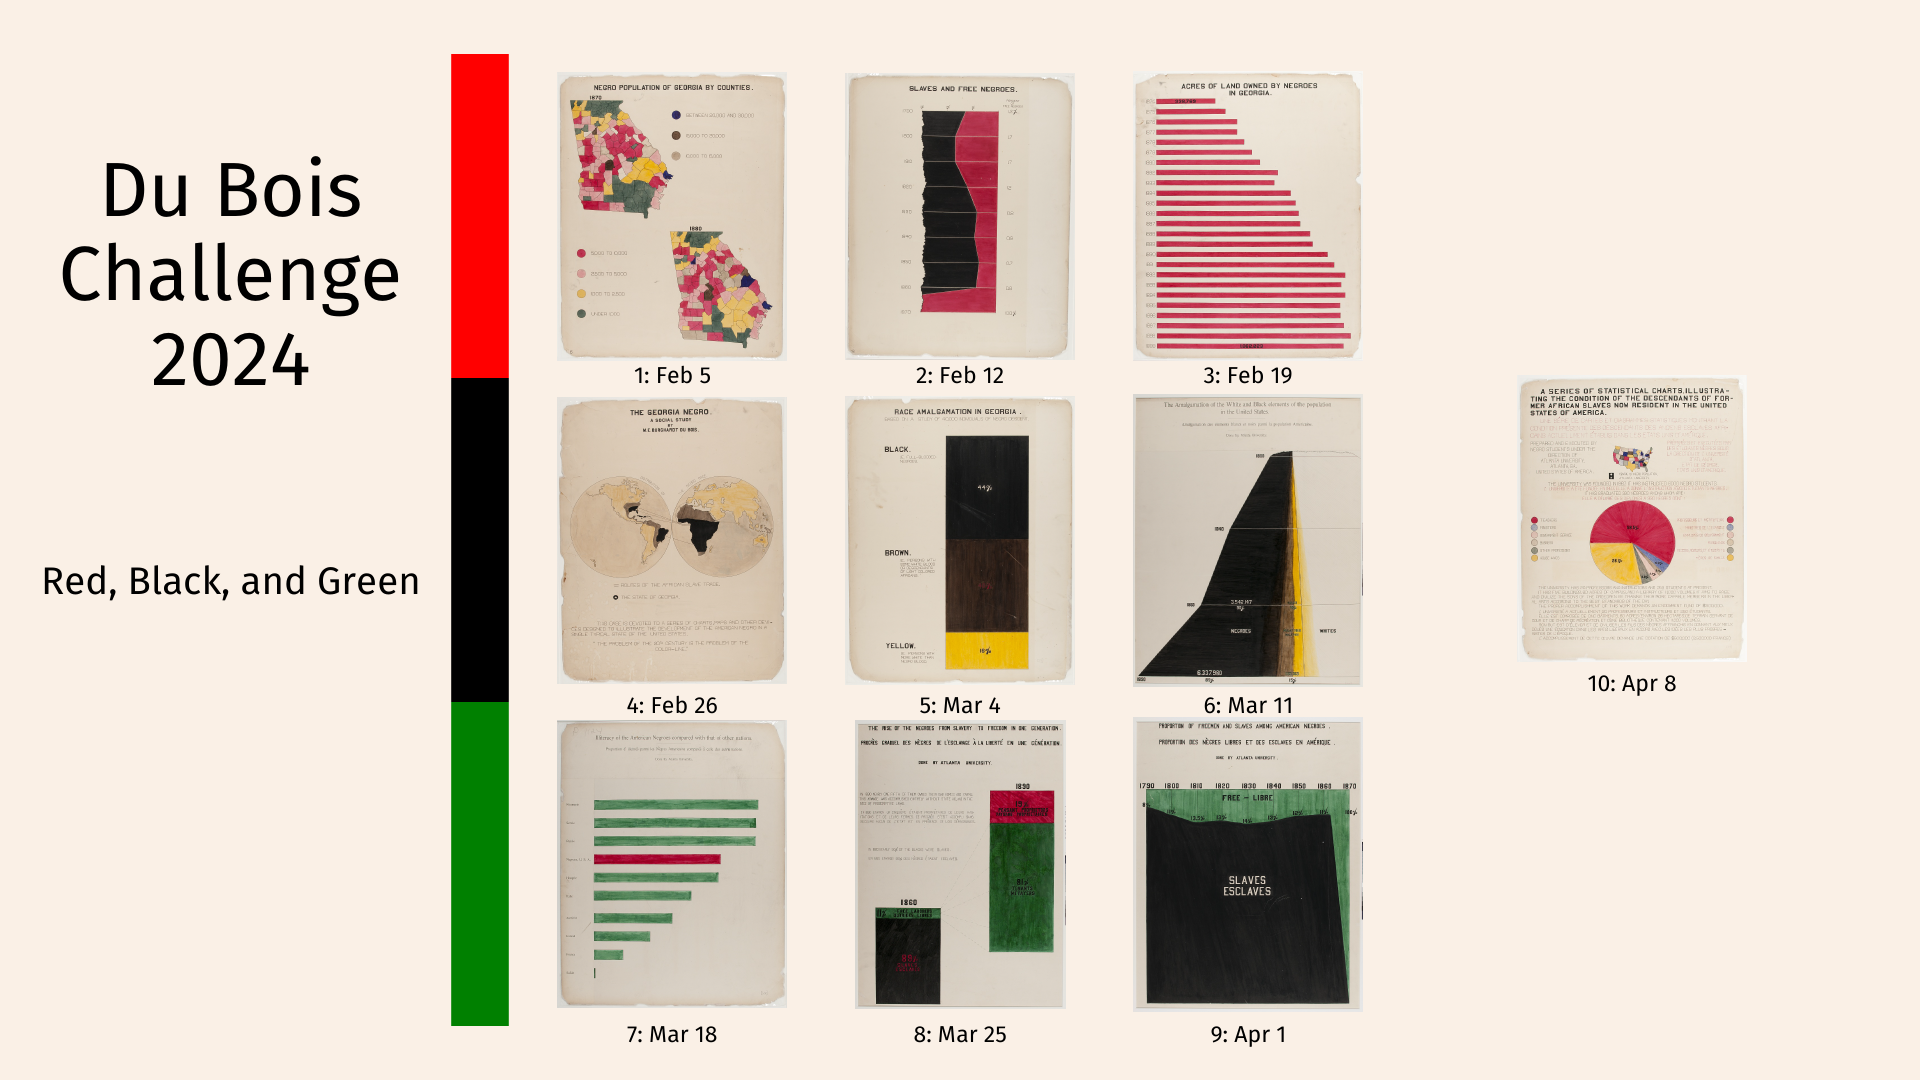
These visualizations were groundbreaking for their time as they provided empirical evidence of the social and economic conditions of African Americans in the United States.
The DuBois Challenge
It’s a competition named after W.E.B. Du Bois, a prominent African American sociologist, historian, and civil rights activist. The task is to replicate the original plates made of hand-made bar graphs, pie charts, and maps, illustrating various socio-economic aspects of African American life at the time.
Key Characteristics
- Color Usage
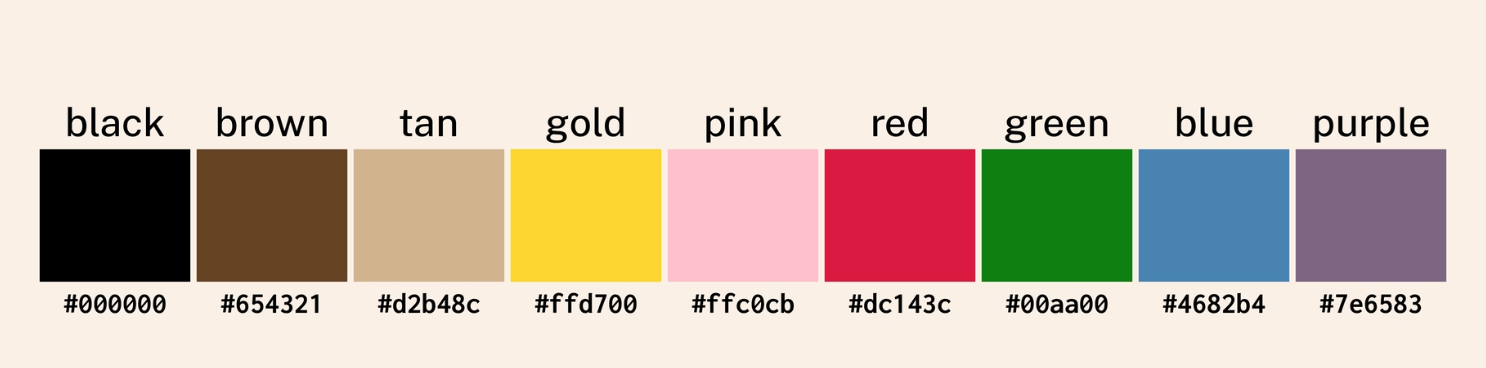
Font Selection
- Public Sans [4] (sans-serif) & Charter [5] (serif fonts)
- B52-ULC W00 [6] for titles & Vasarely-Light [7] for running text.
- Vocaltype history of Du Bois
Layout Design