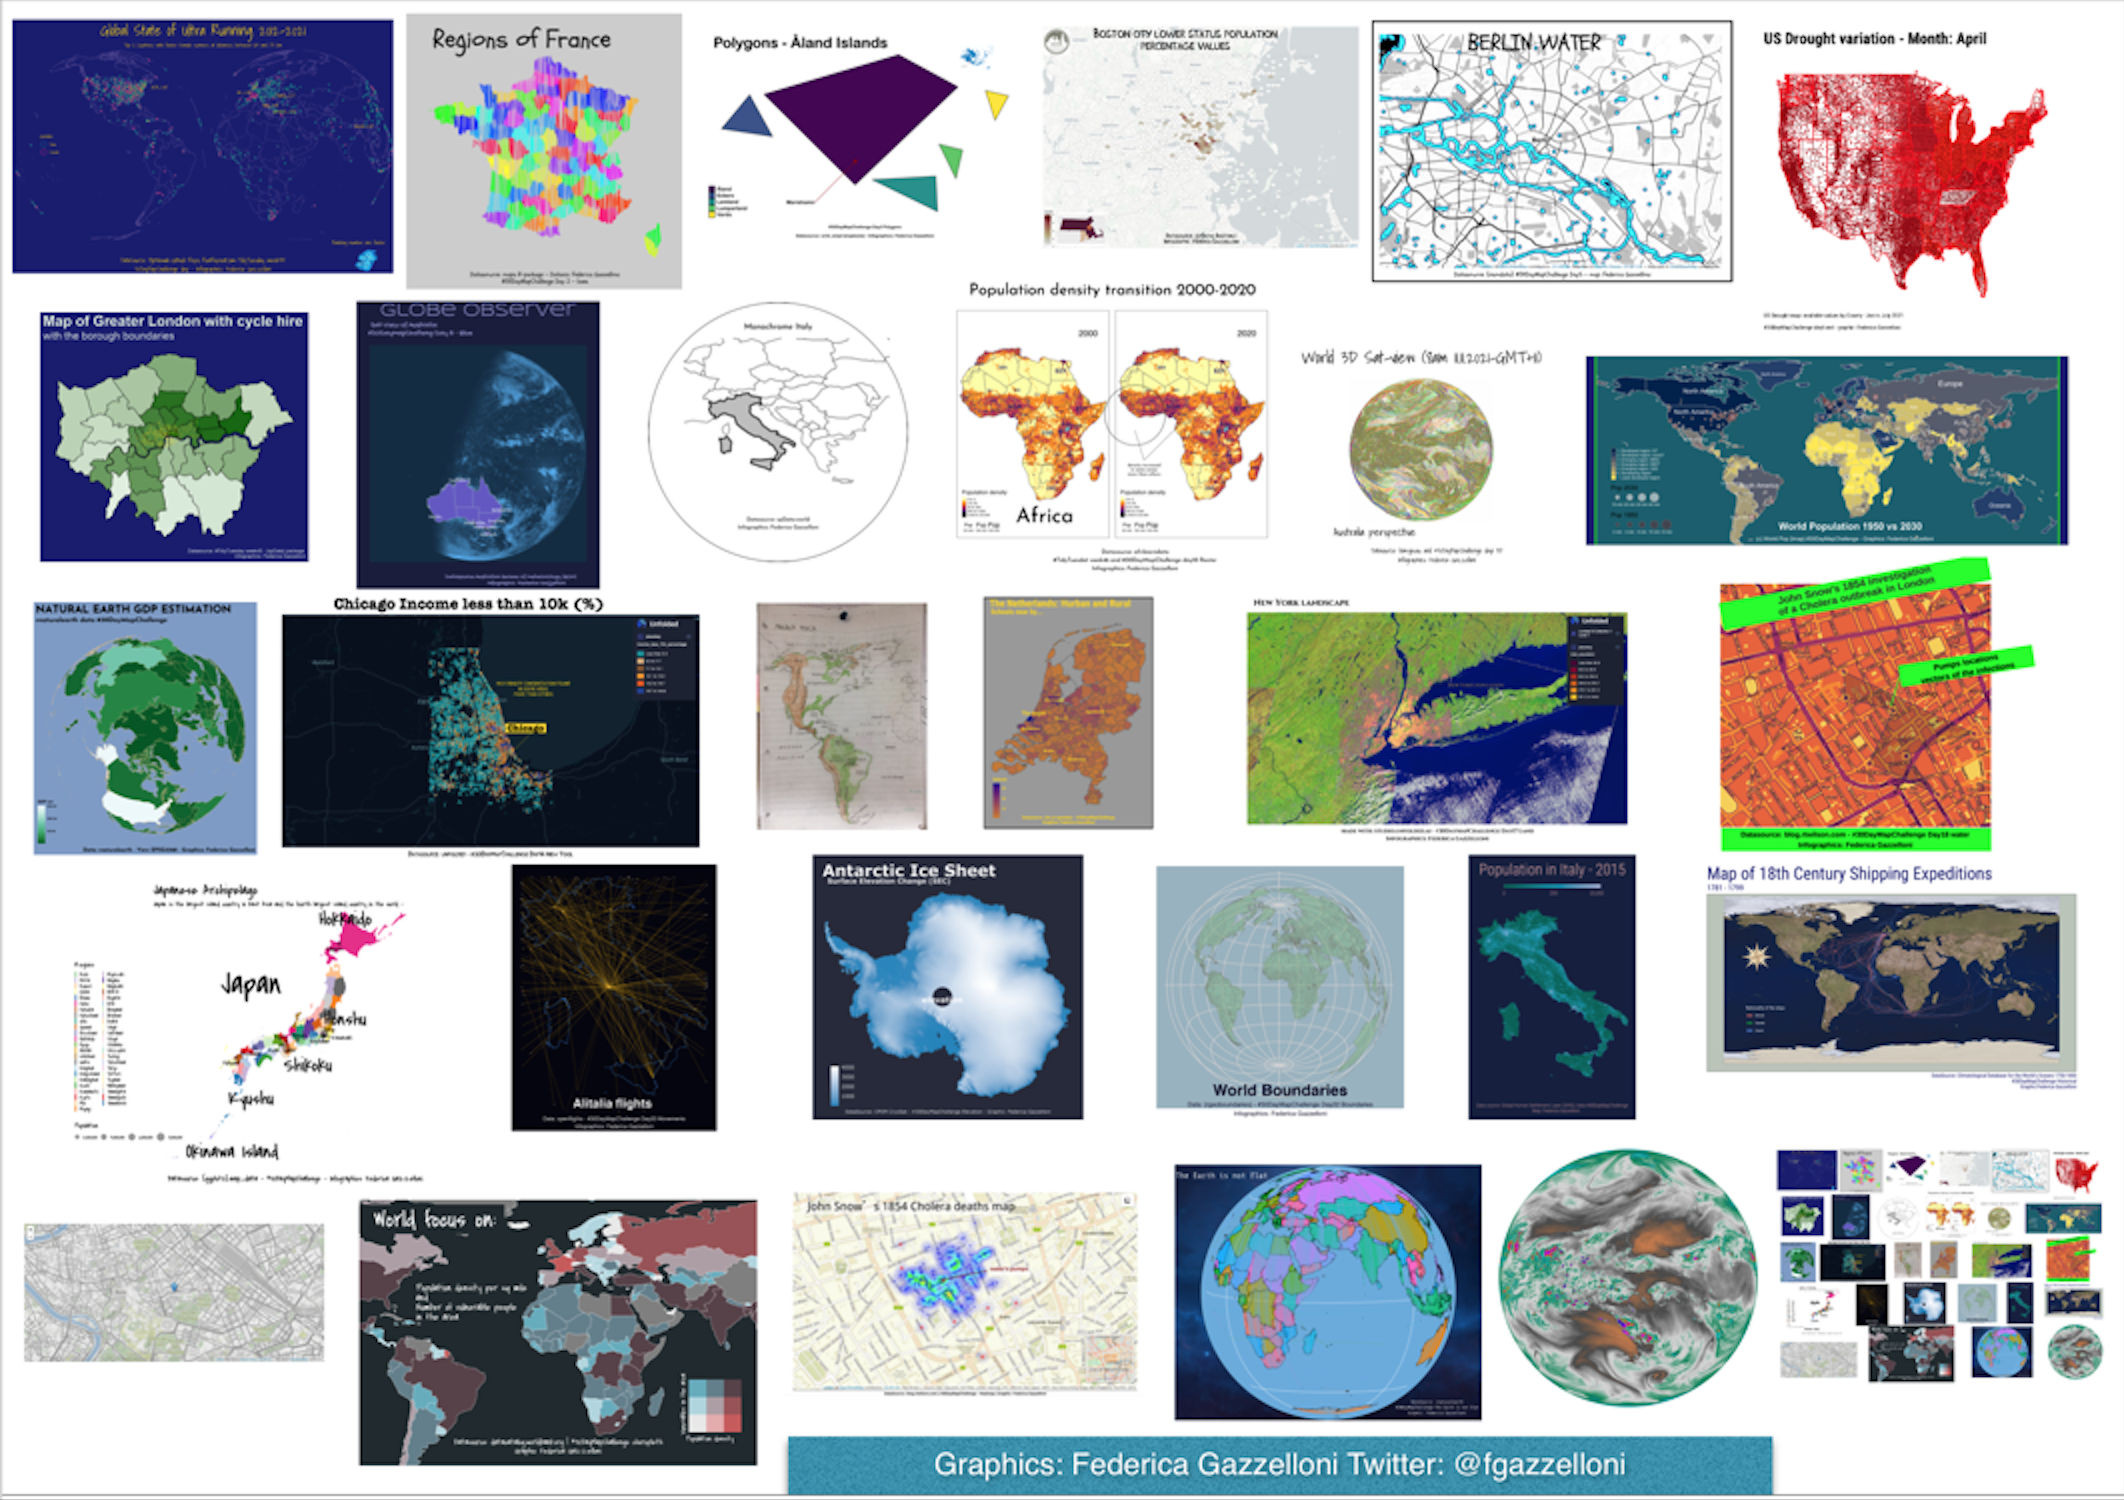
collage
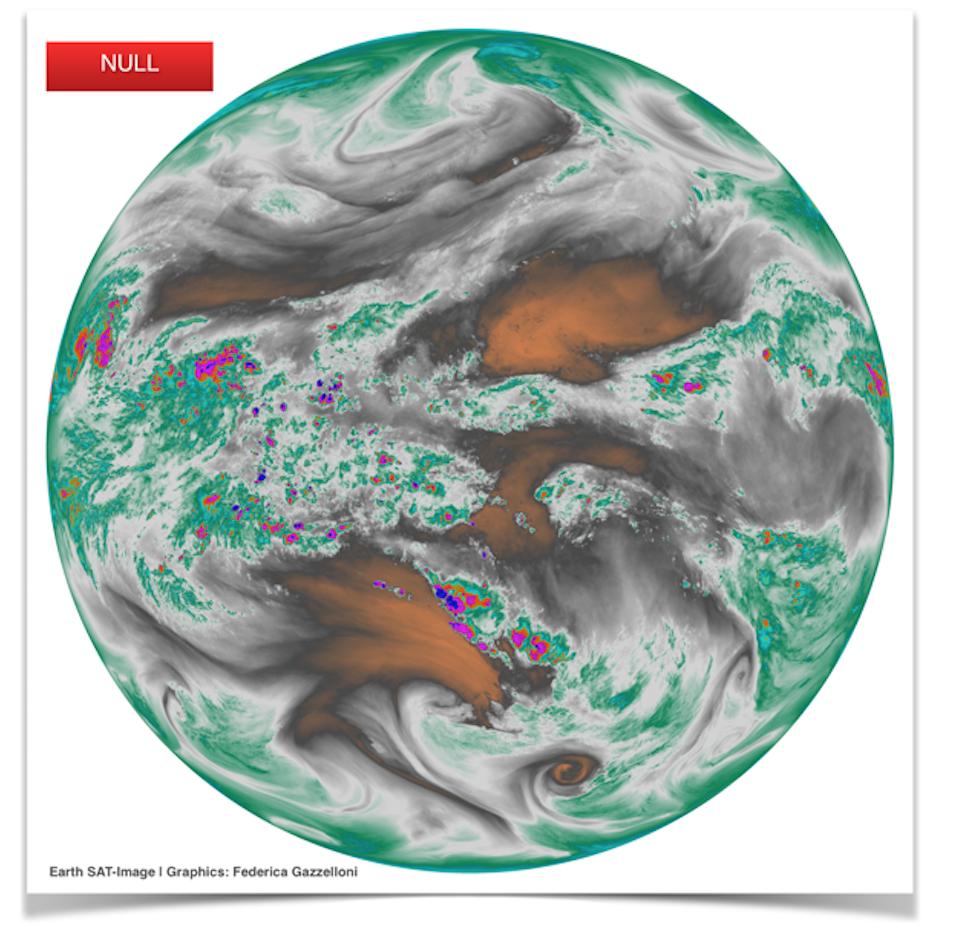
.tif
Earth-SAT
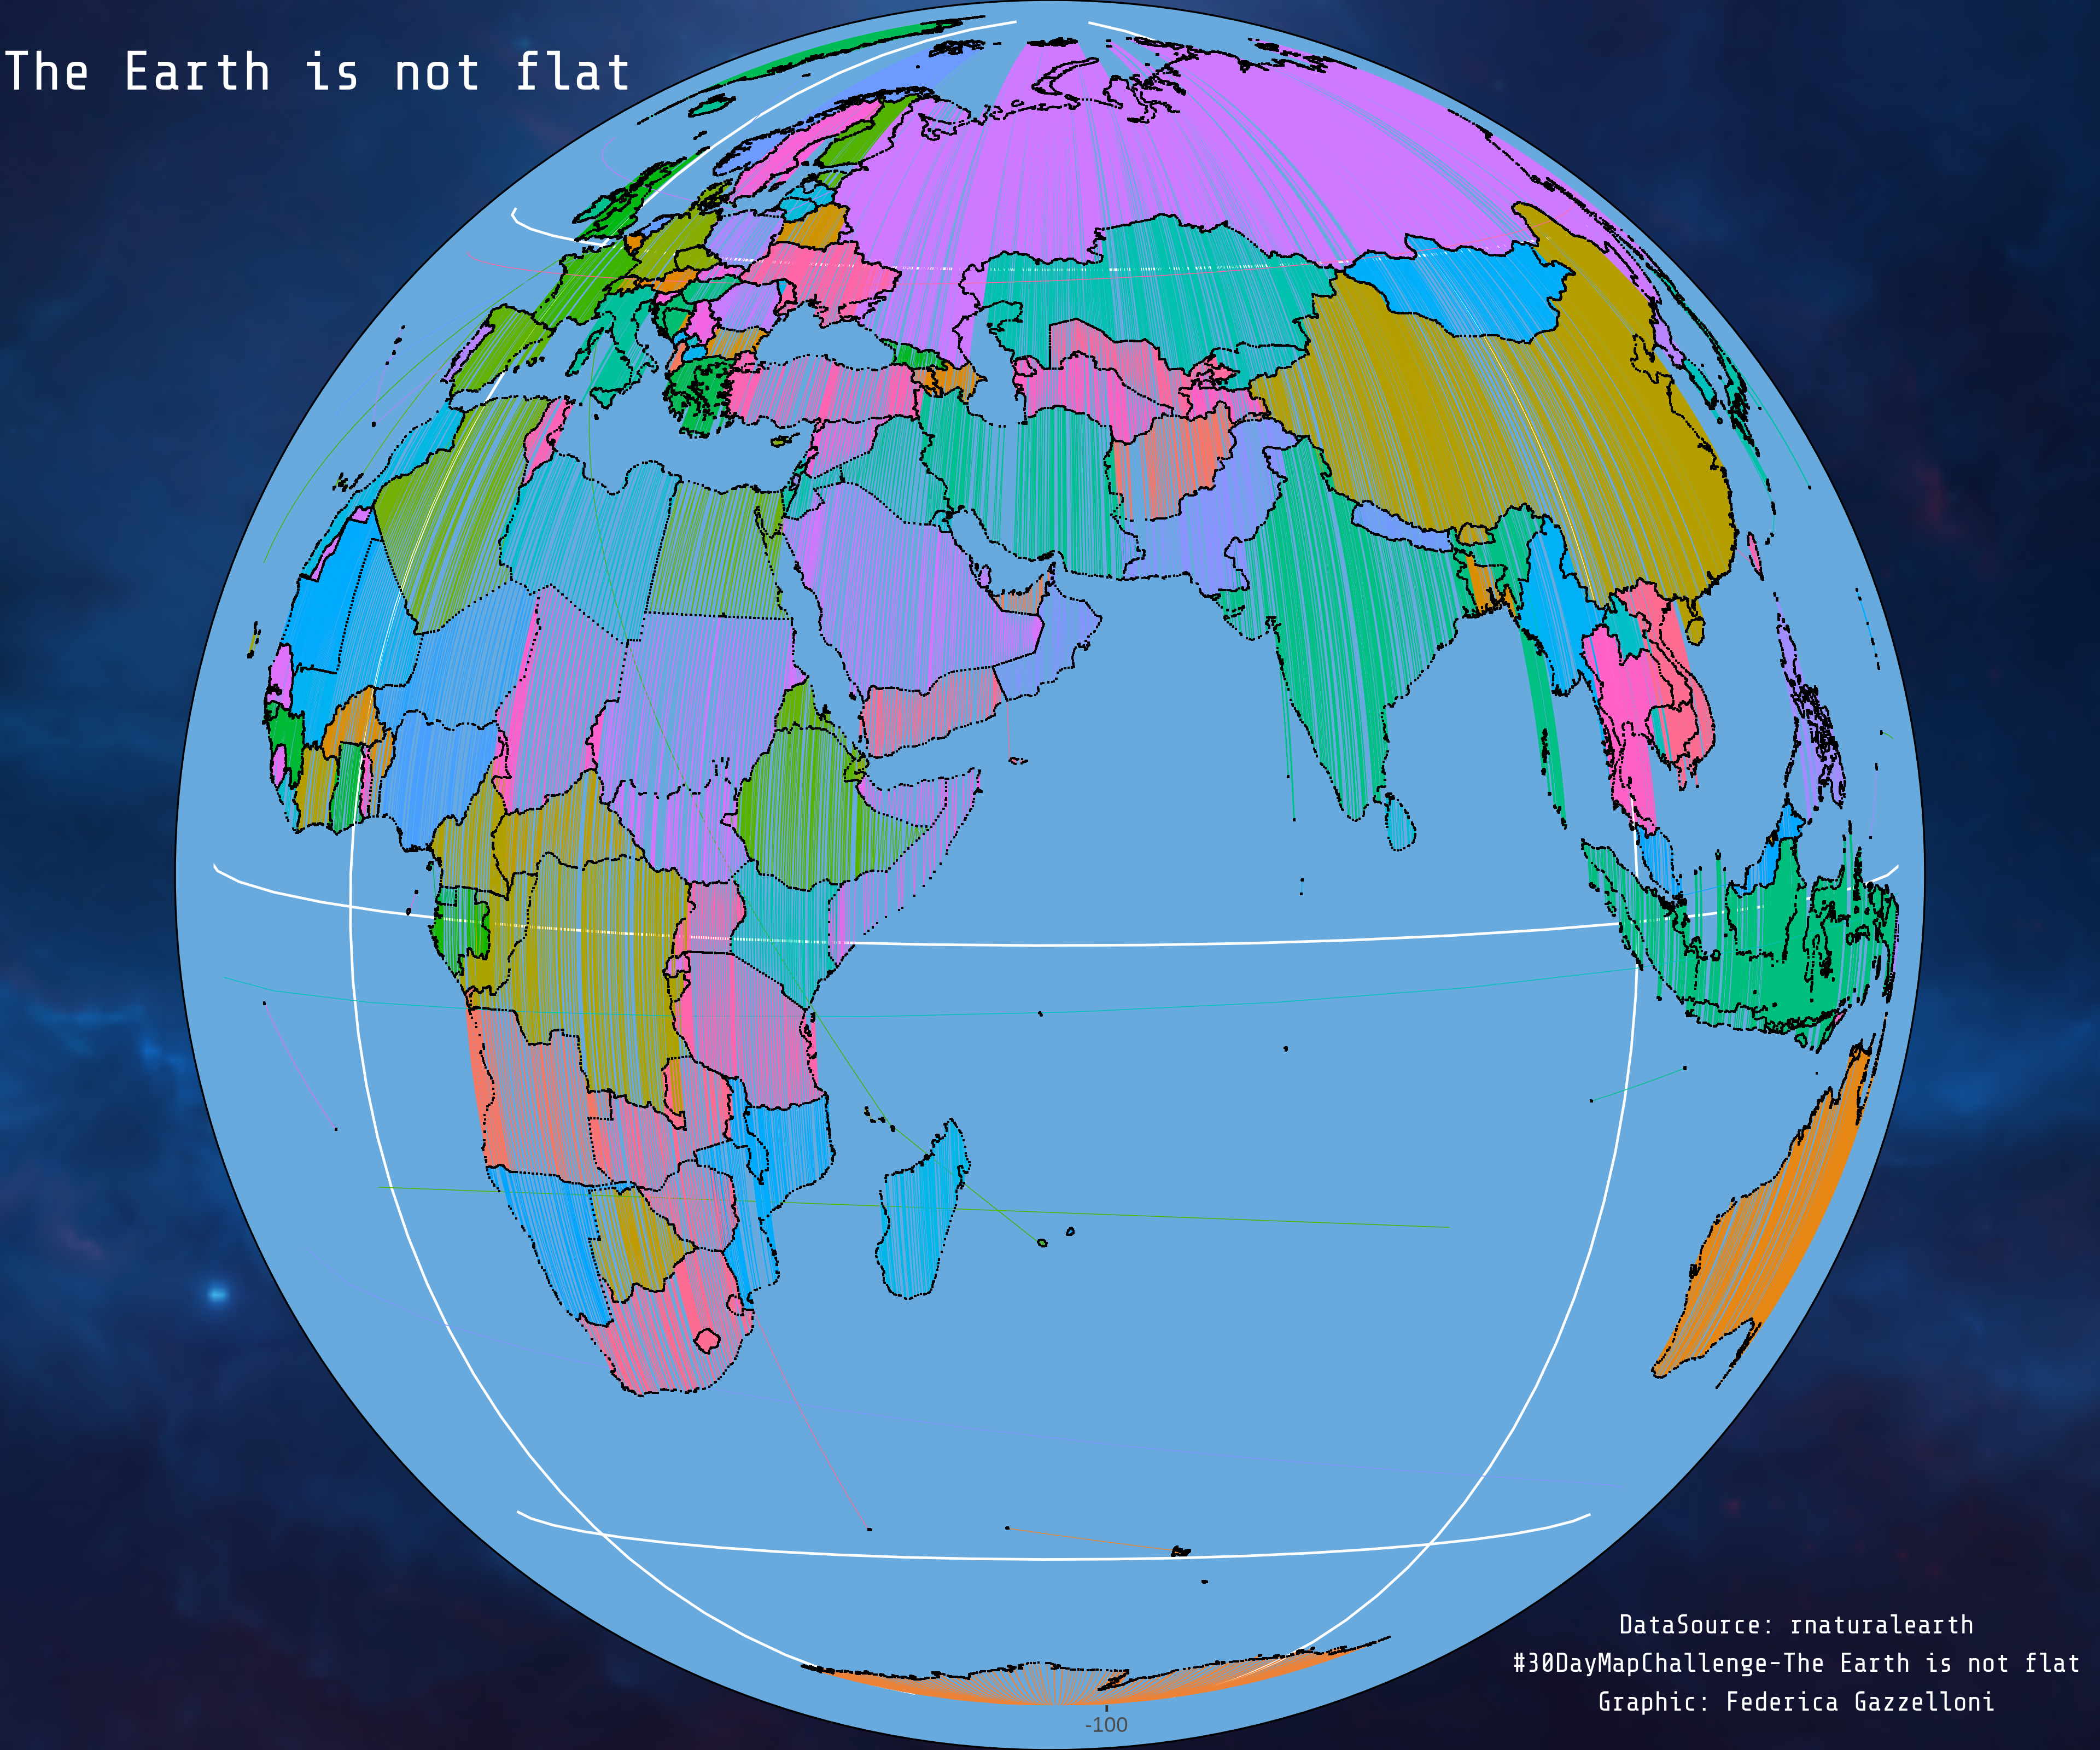
Globe
rnaturalearth
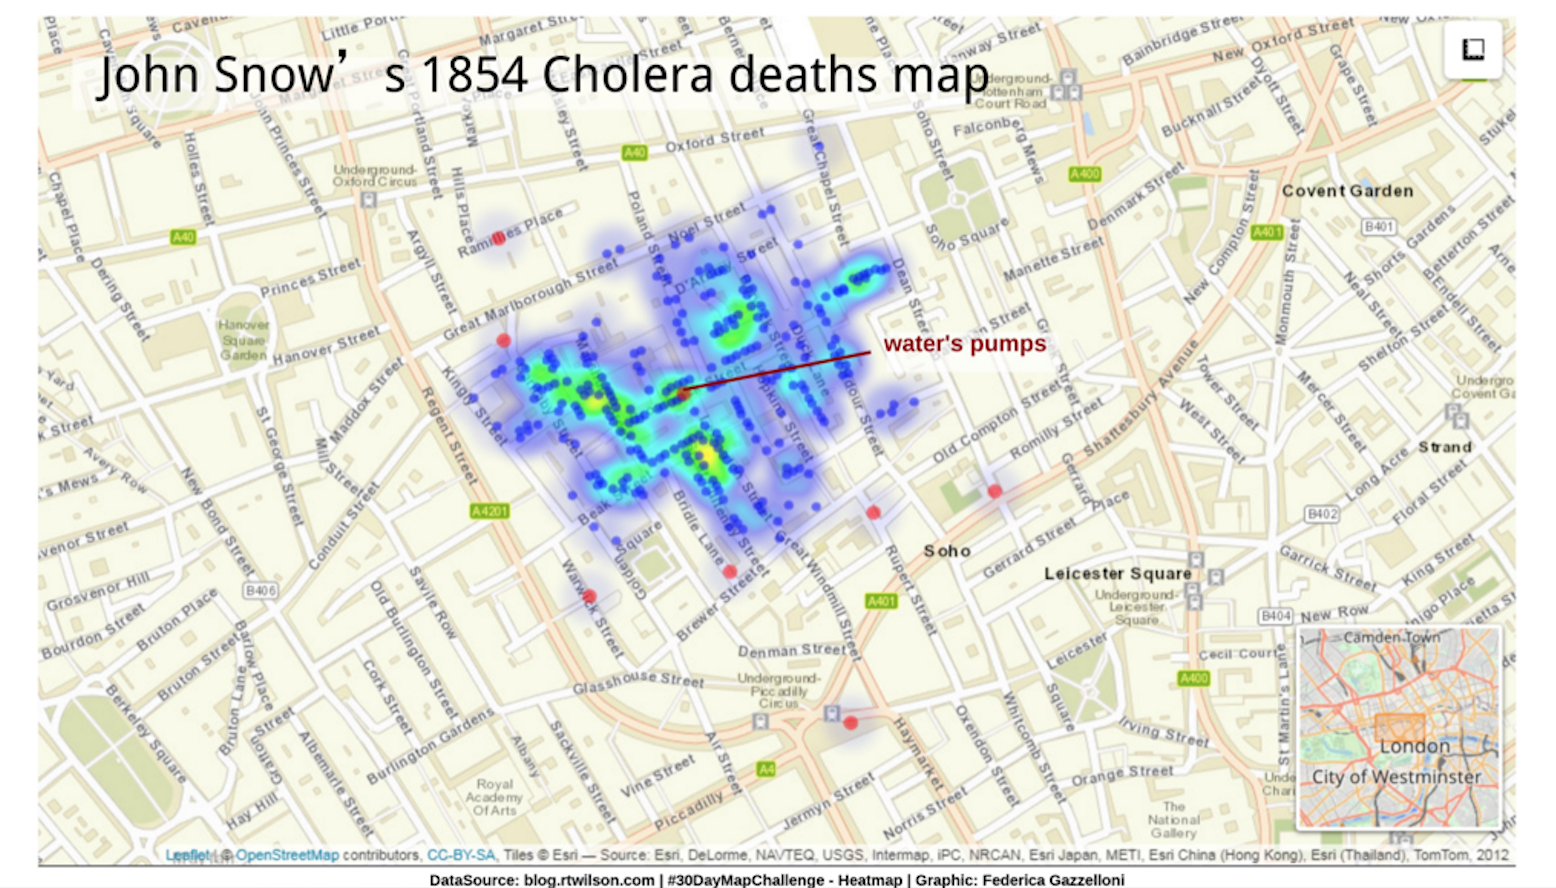
Blog.RtWilson.com
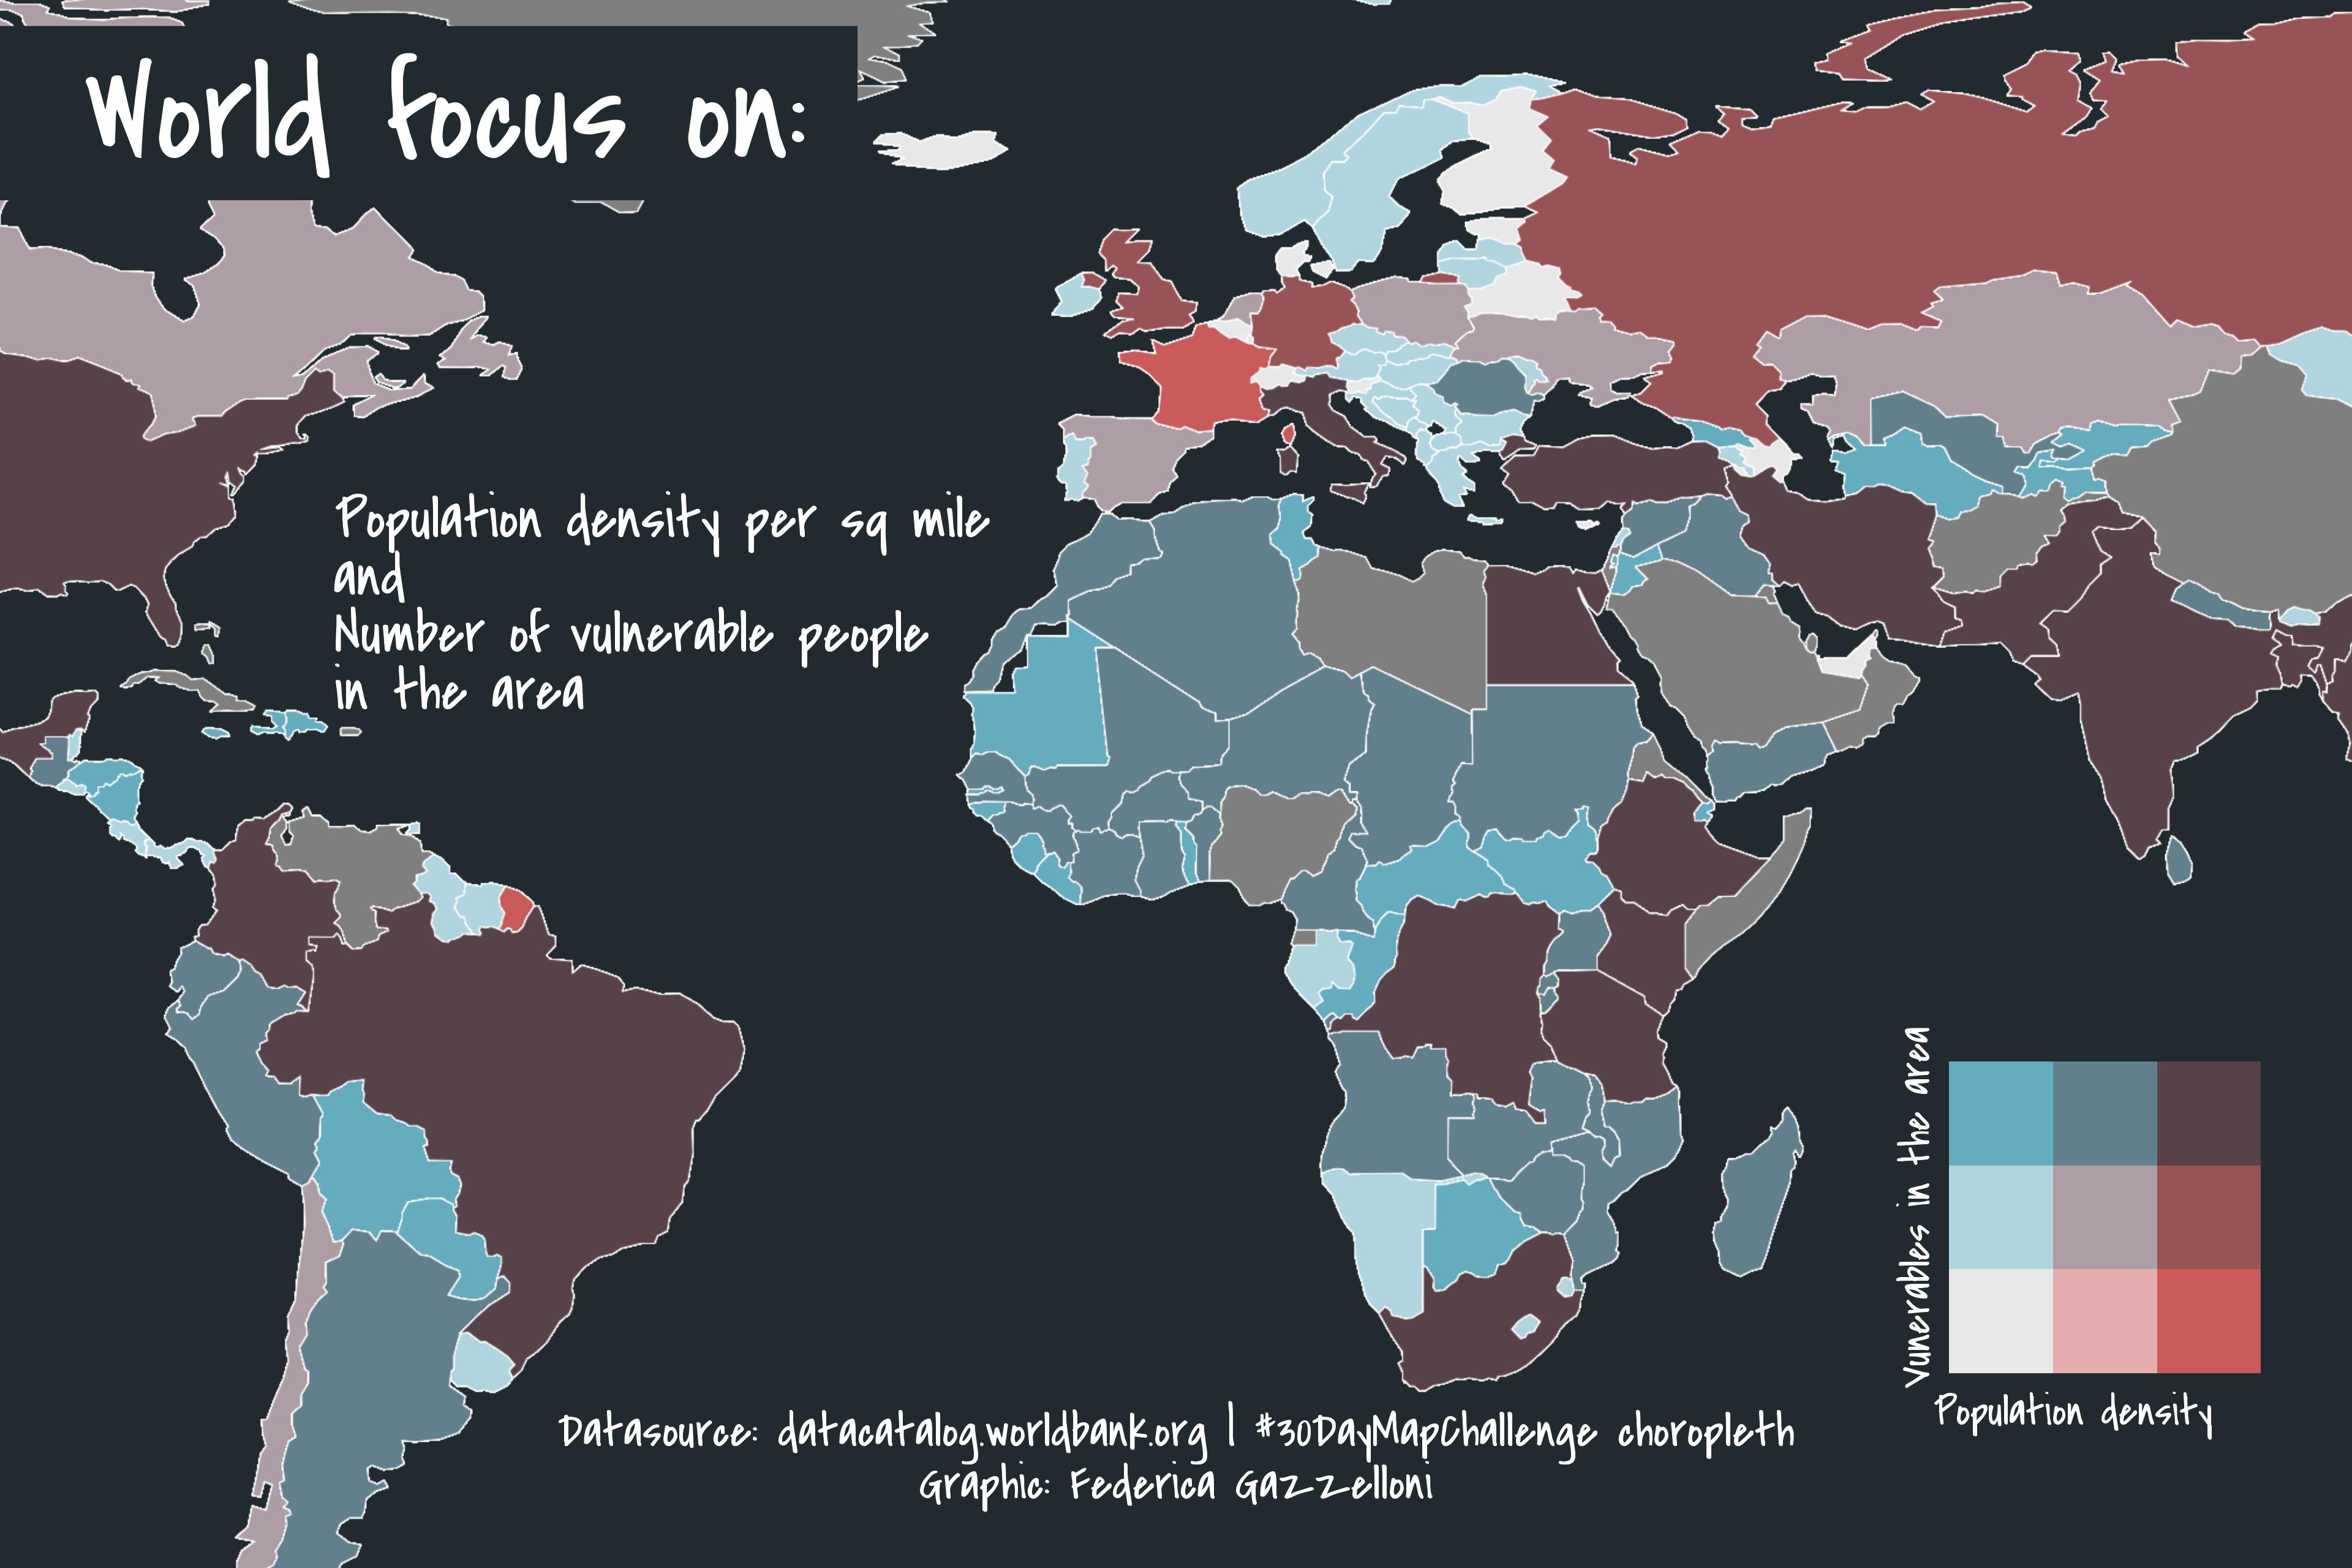
World Population density
WorldBank Datacatalog
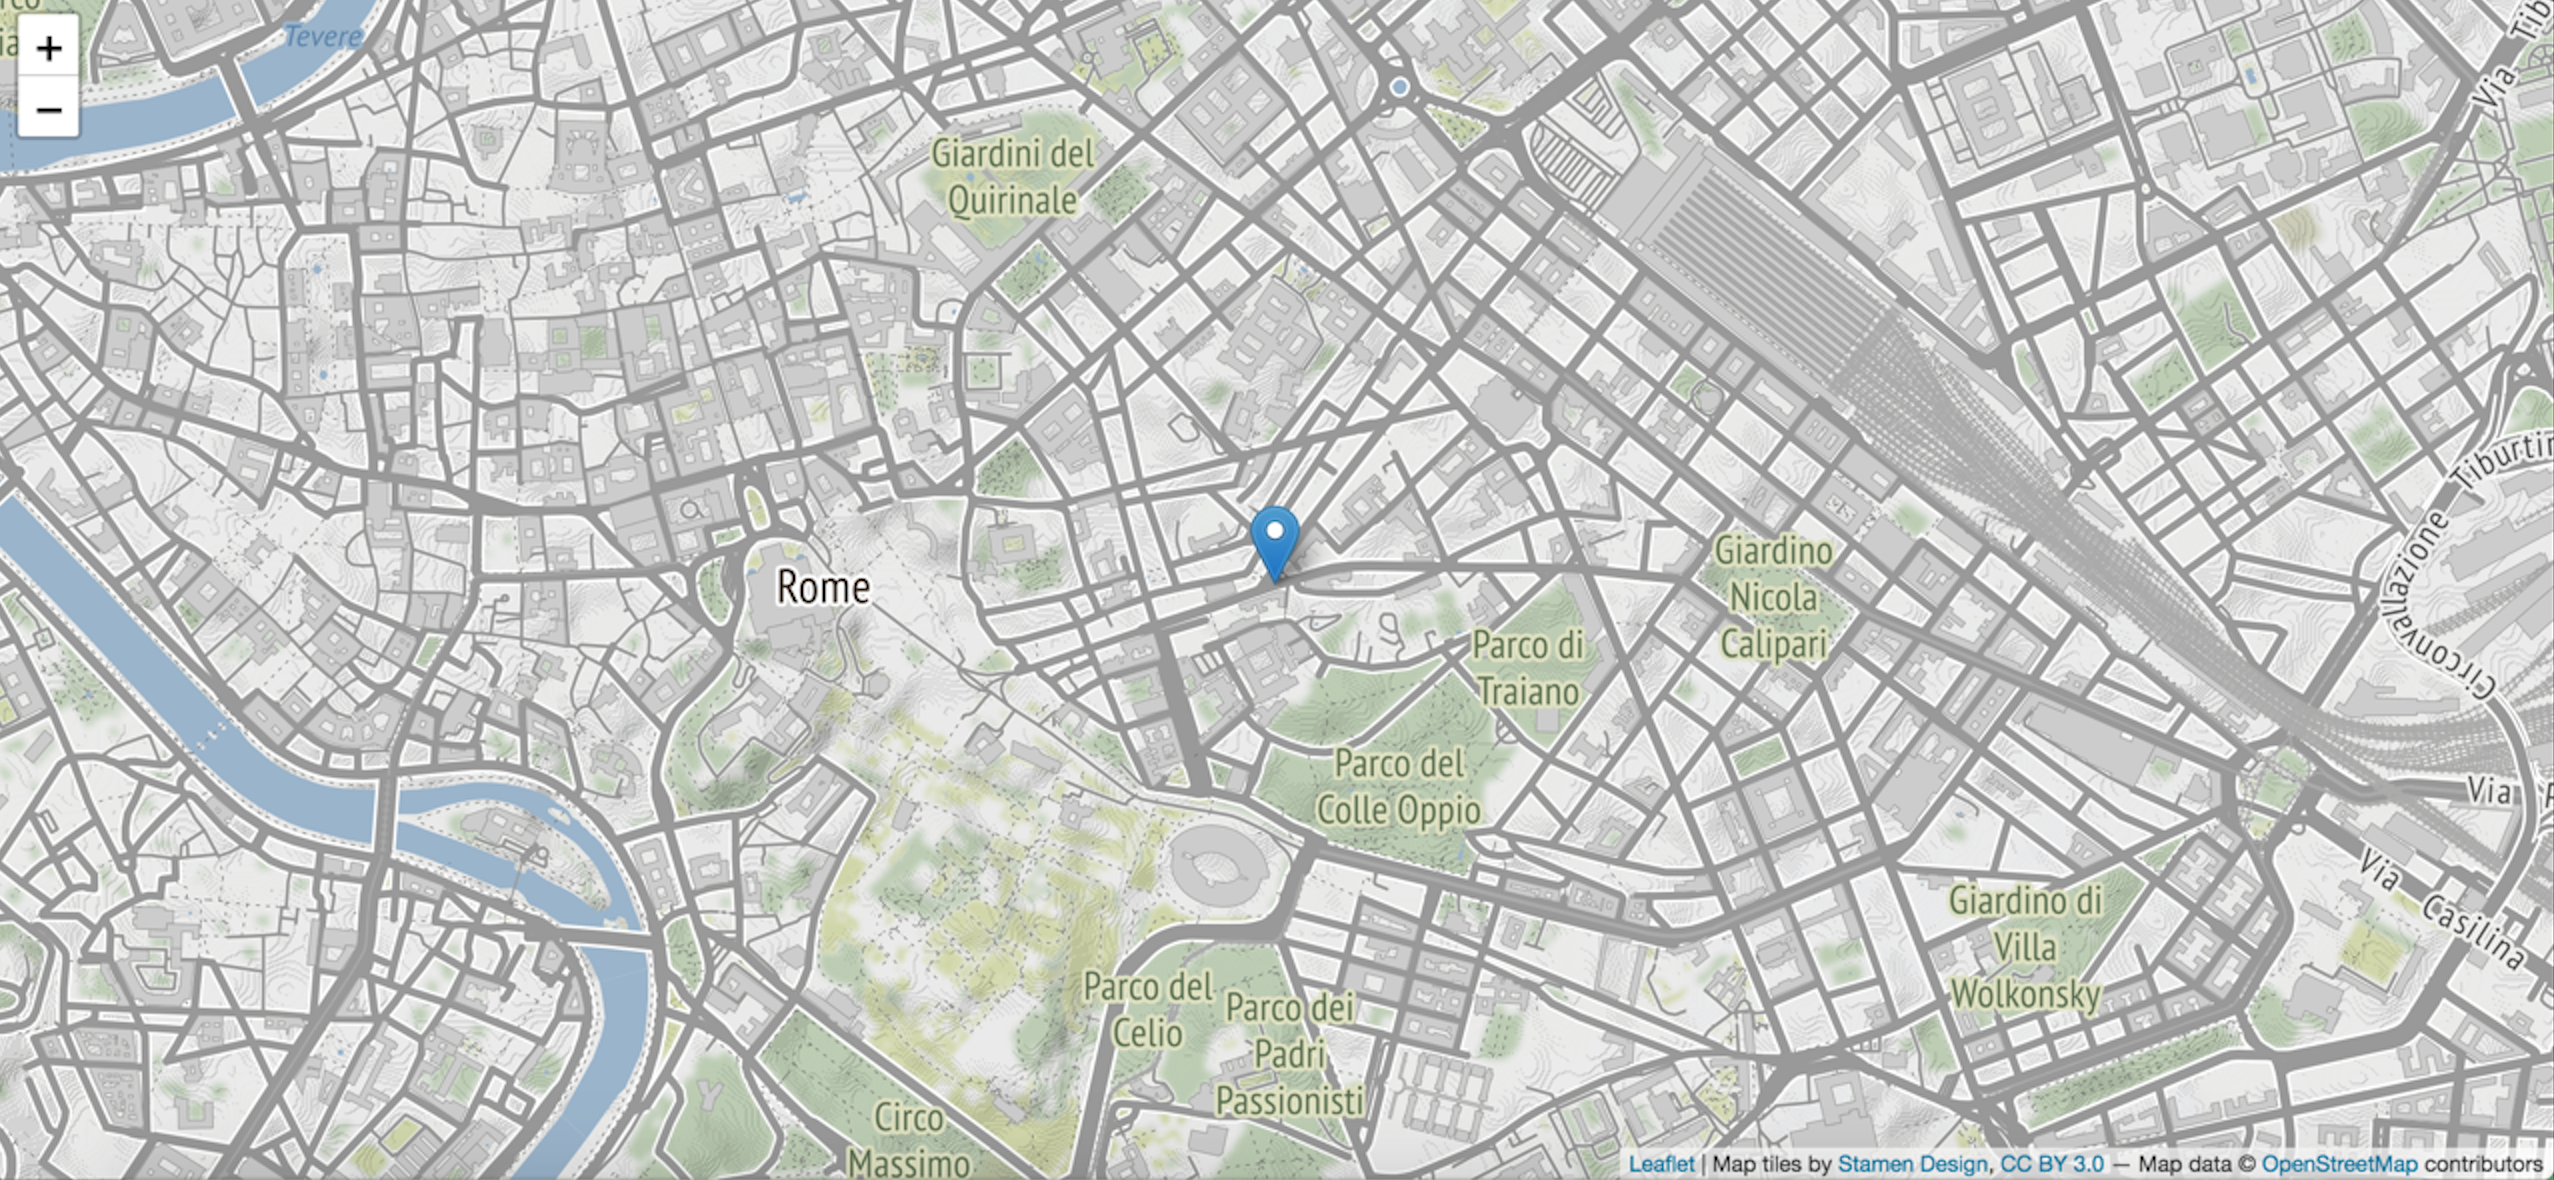
Leaflet
My birthplace: Rome
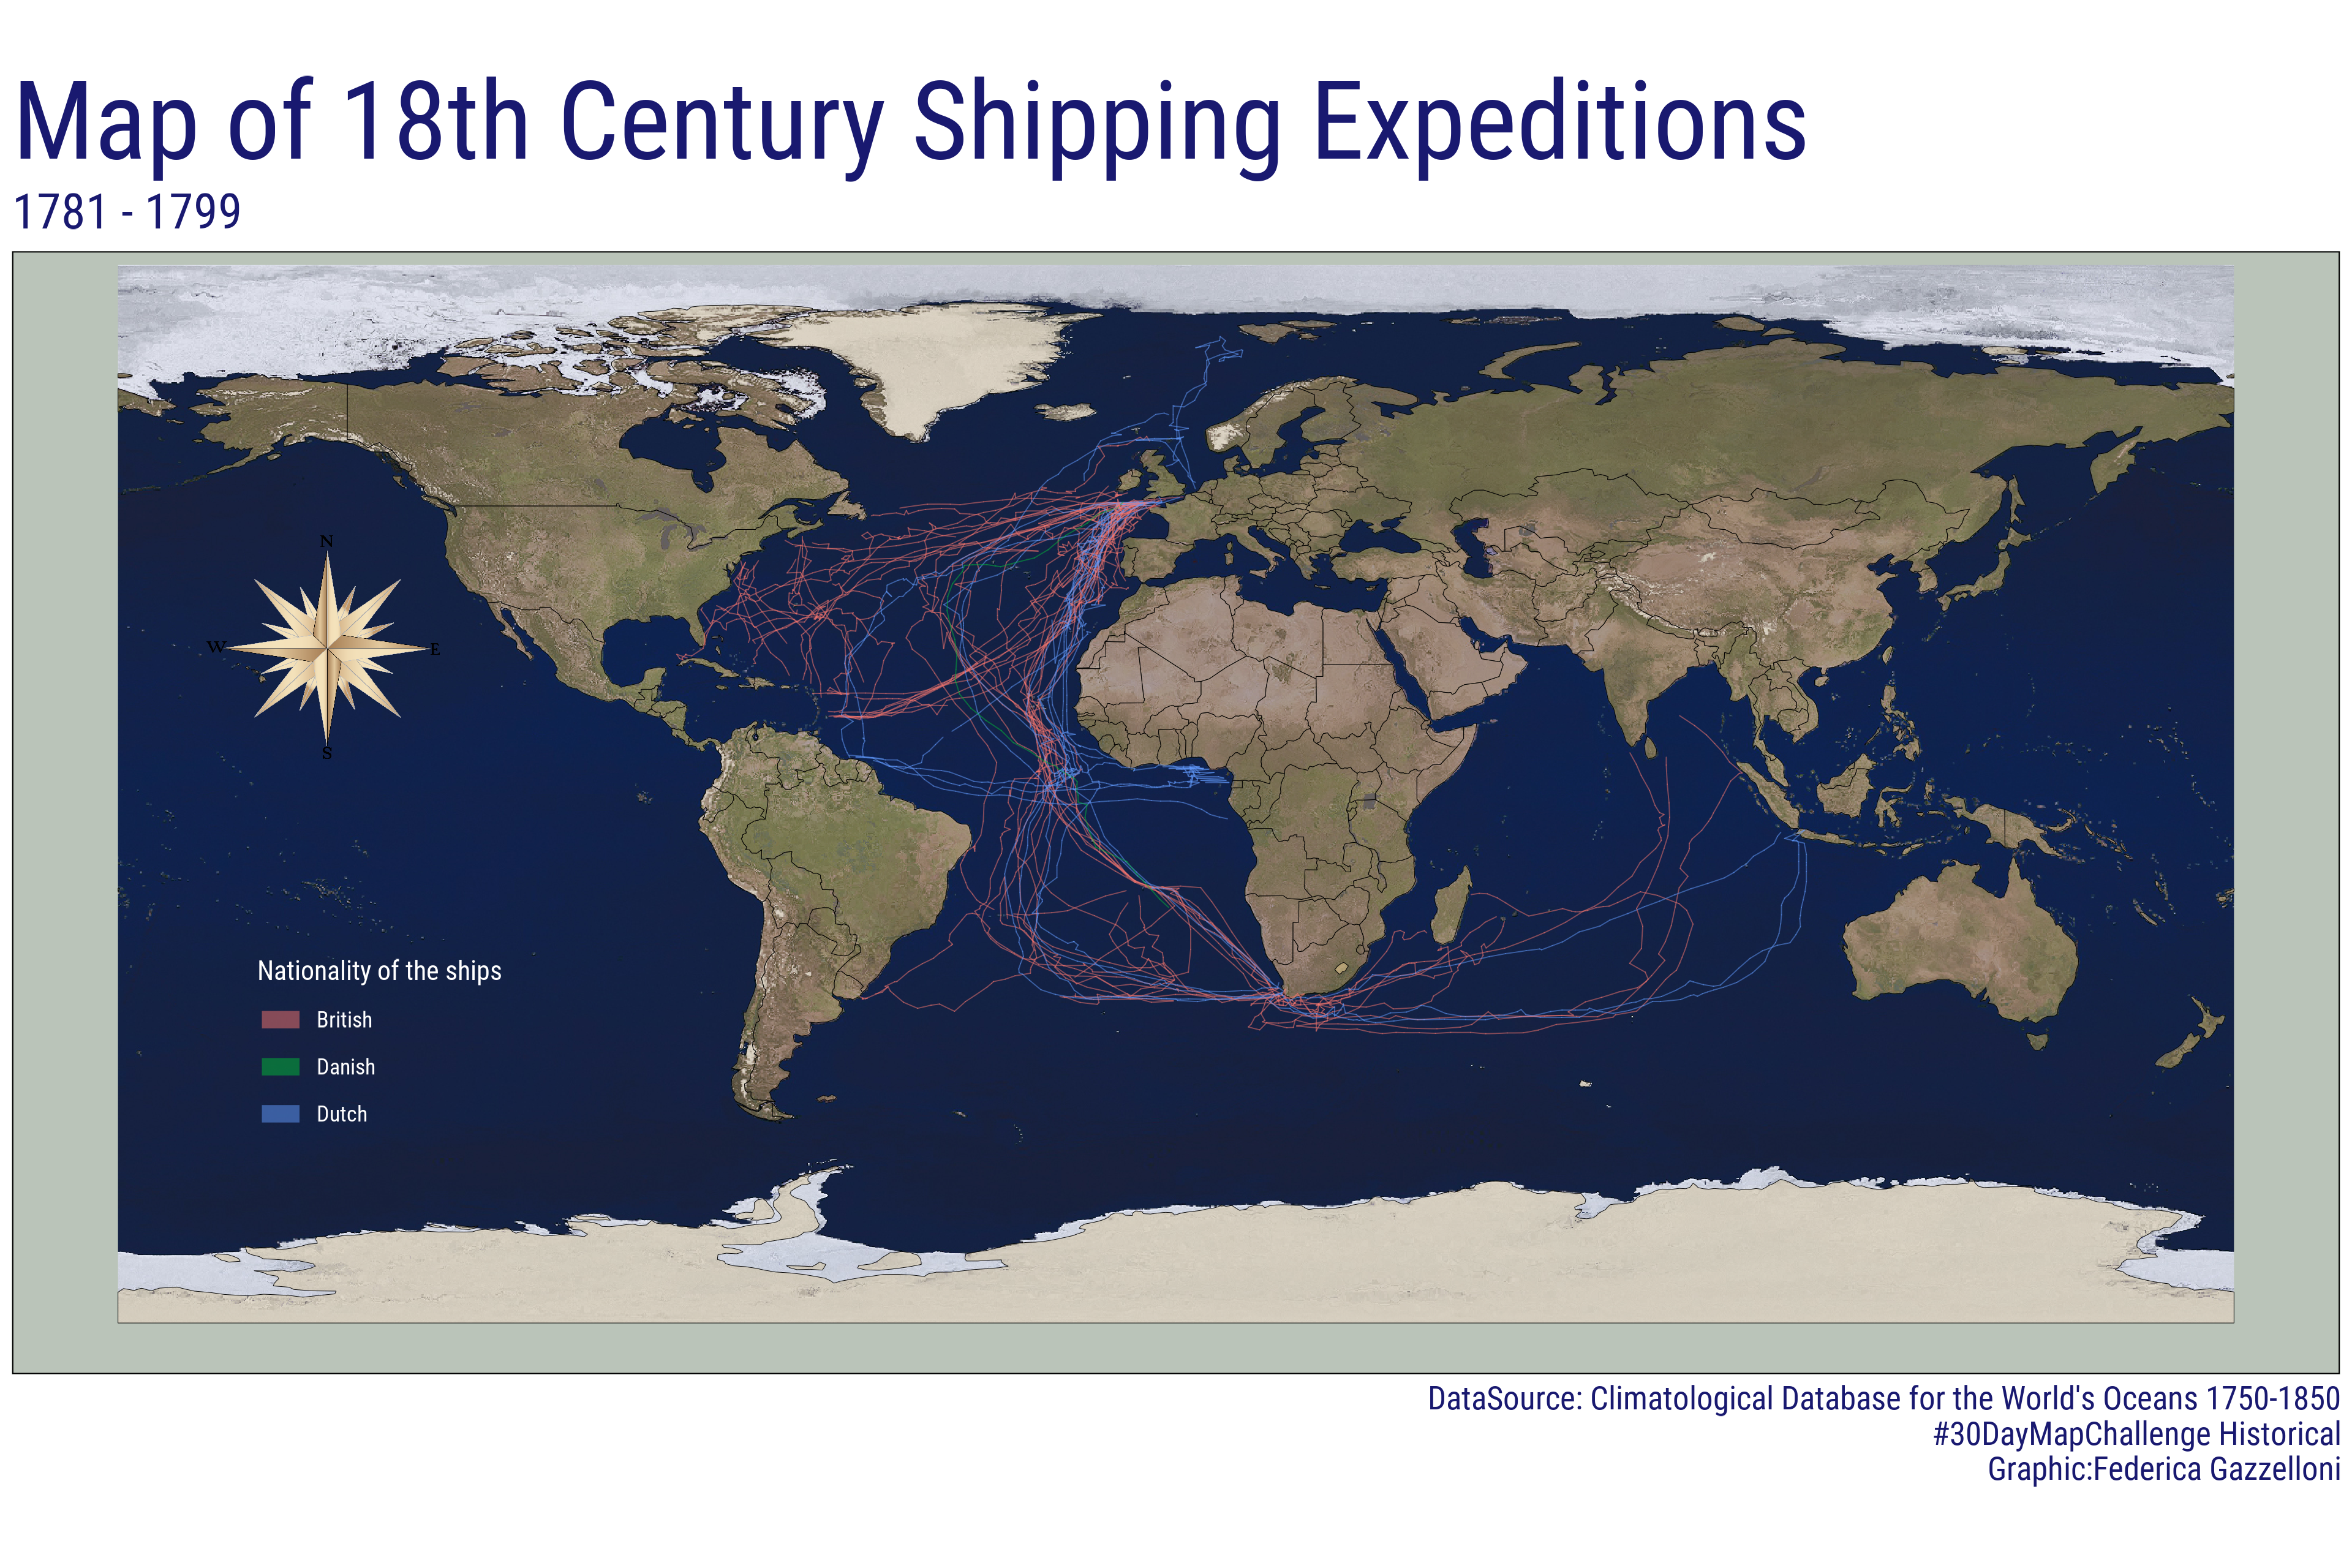
18th Century Shipping Expeditions 1781 - 1799
Climatological Database
World's Oceans 1750-1850
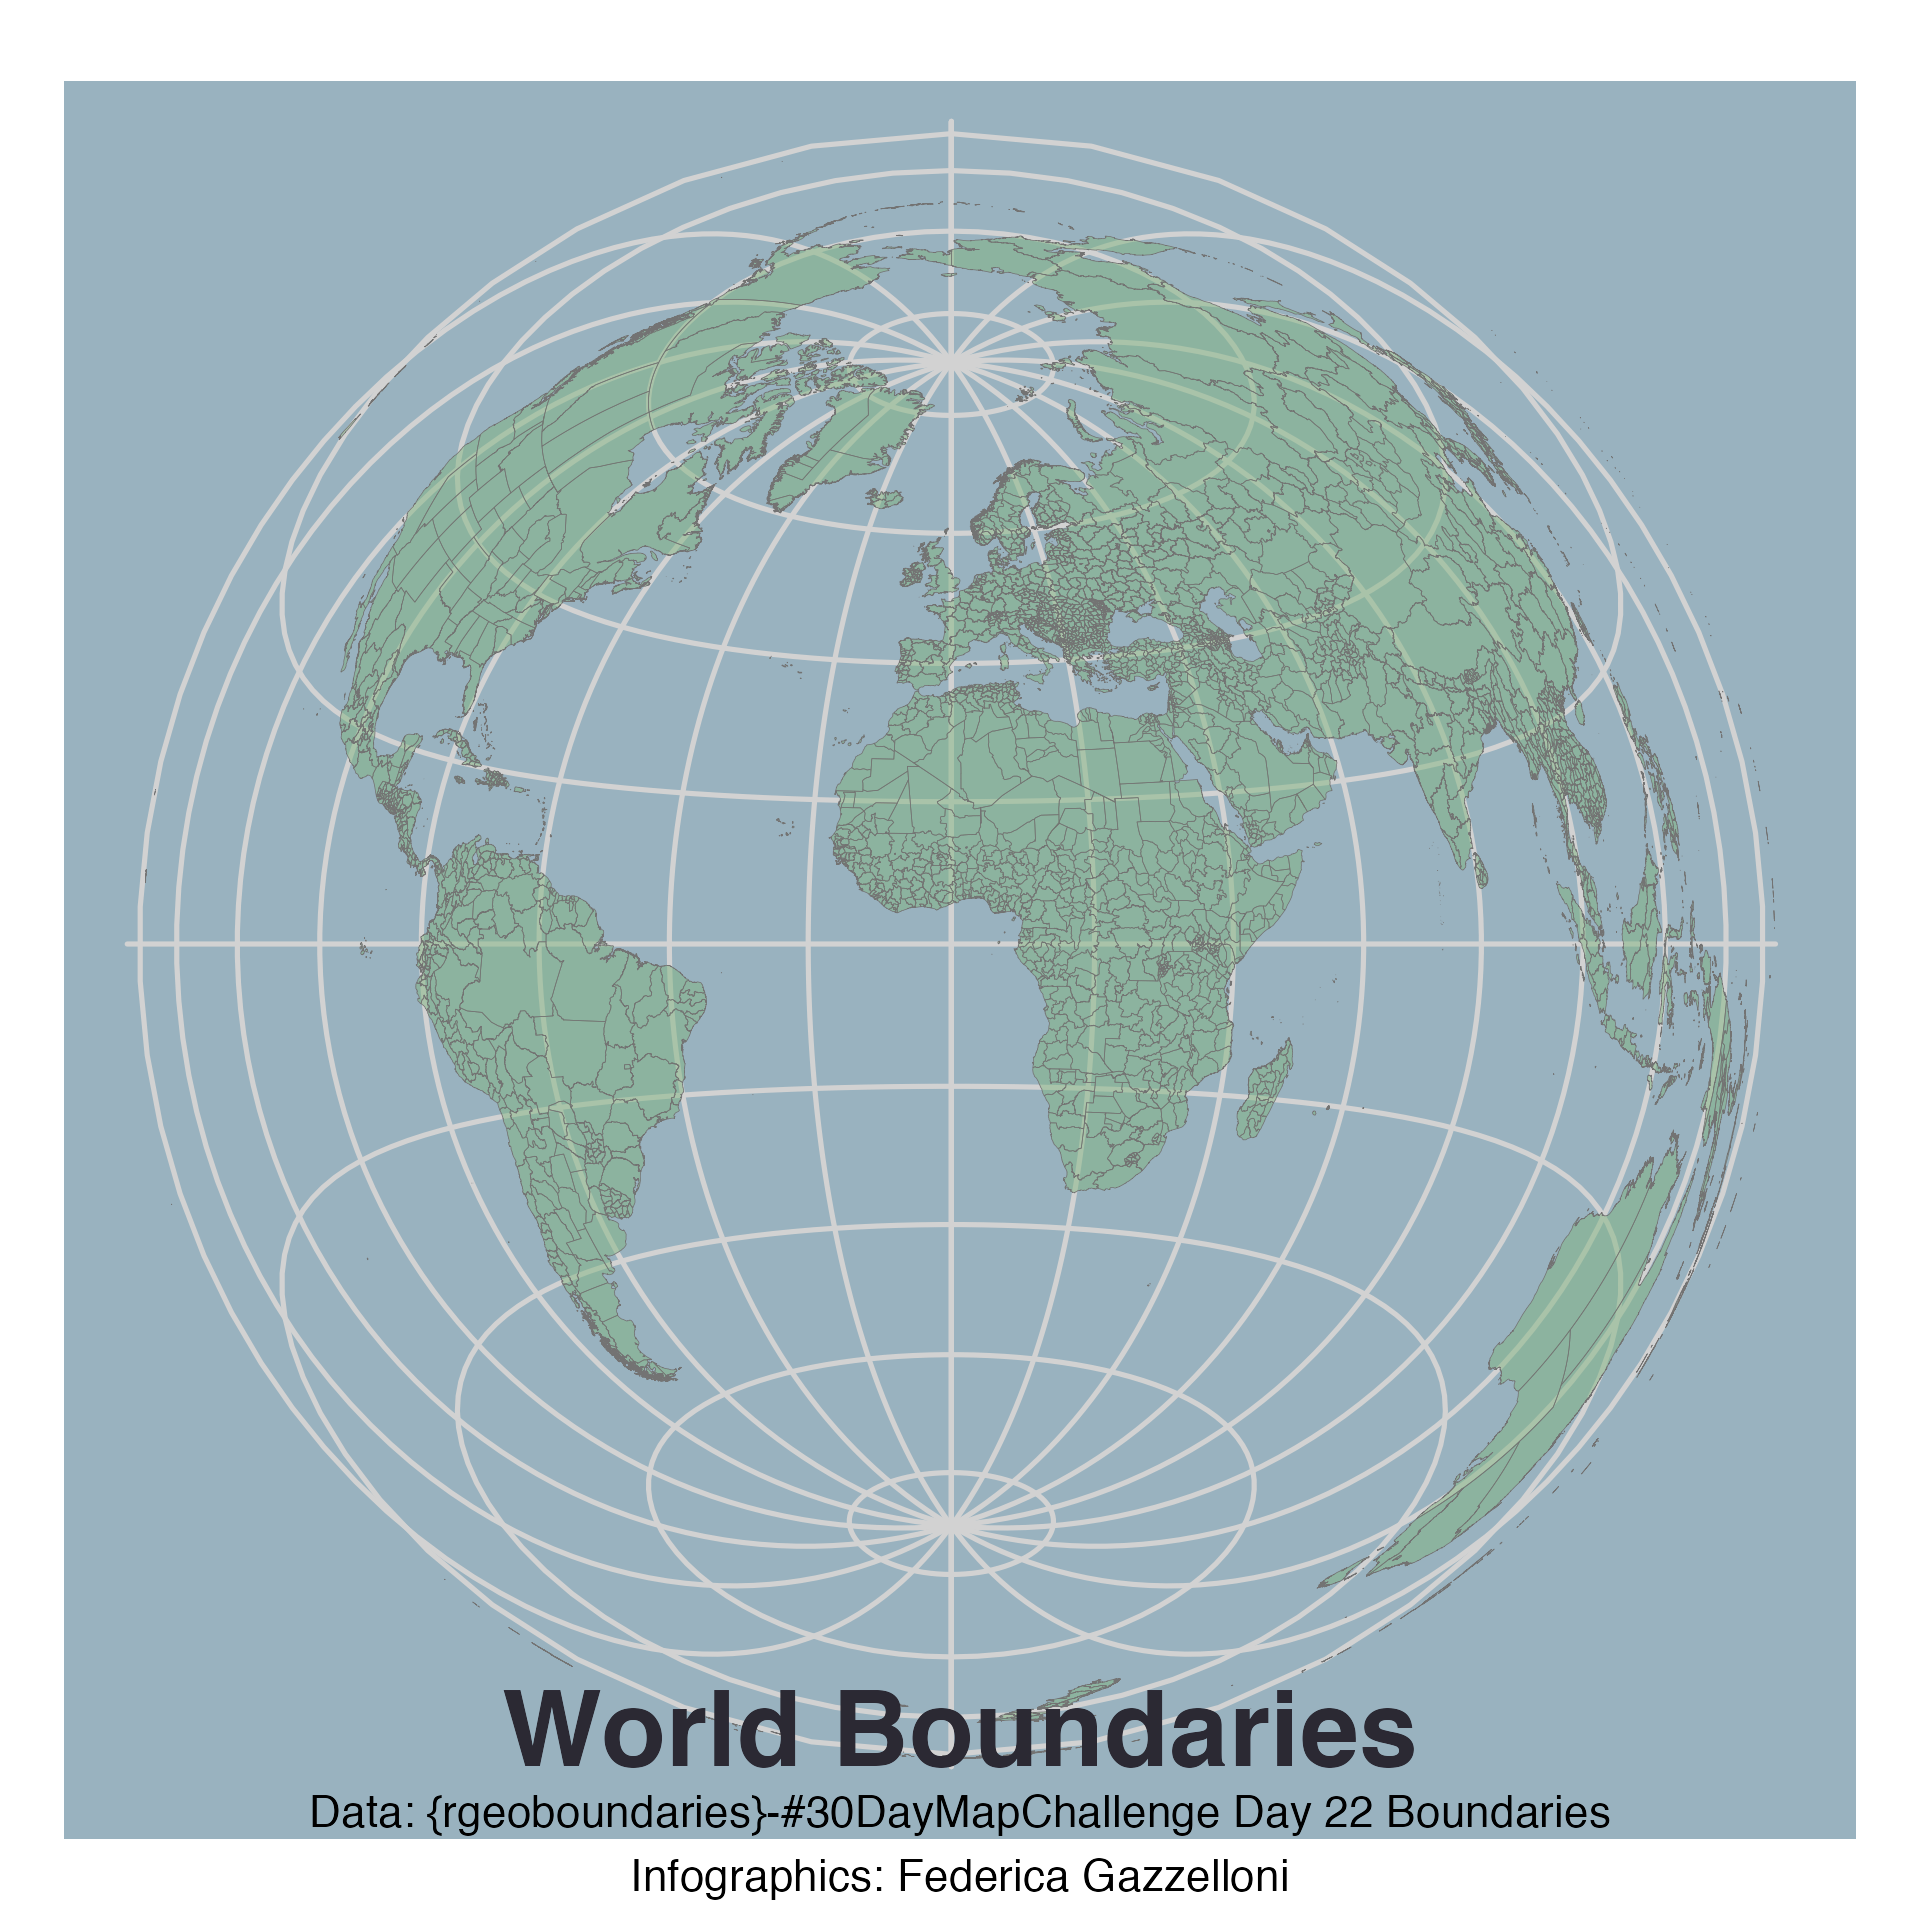
World
{rgeoboundaries}
Alaska!
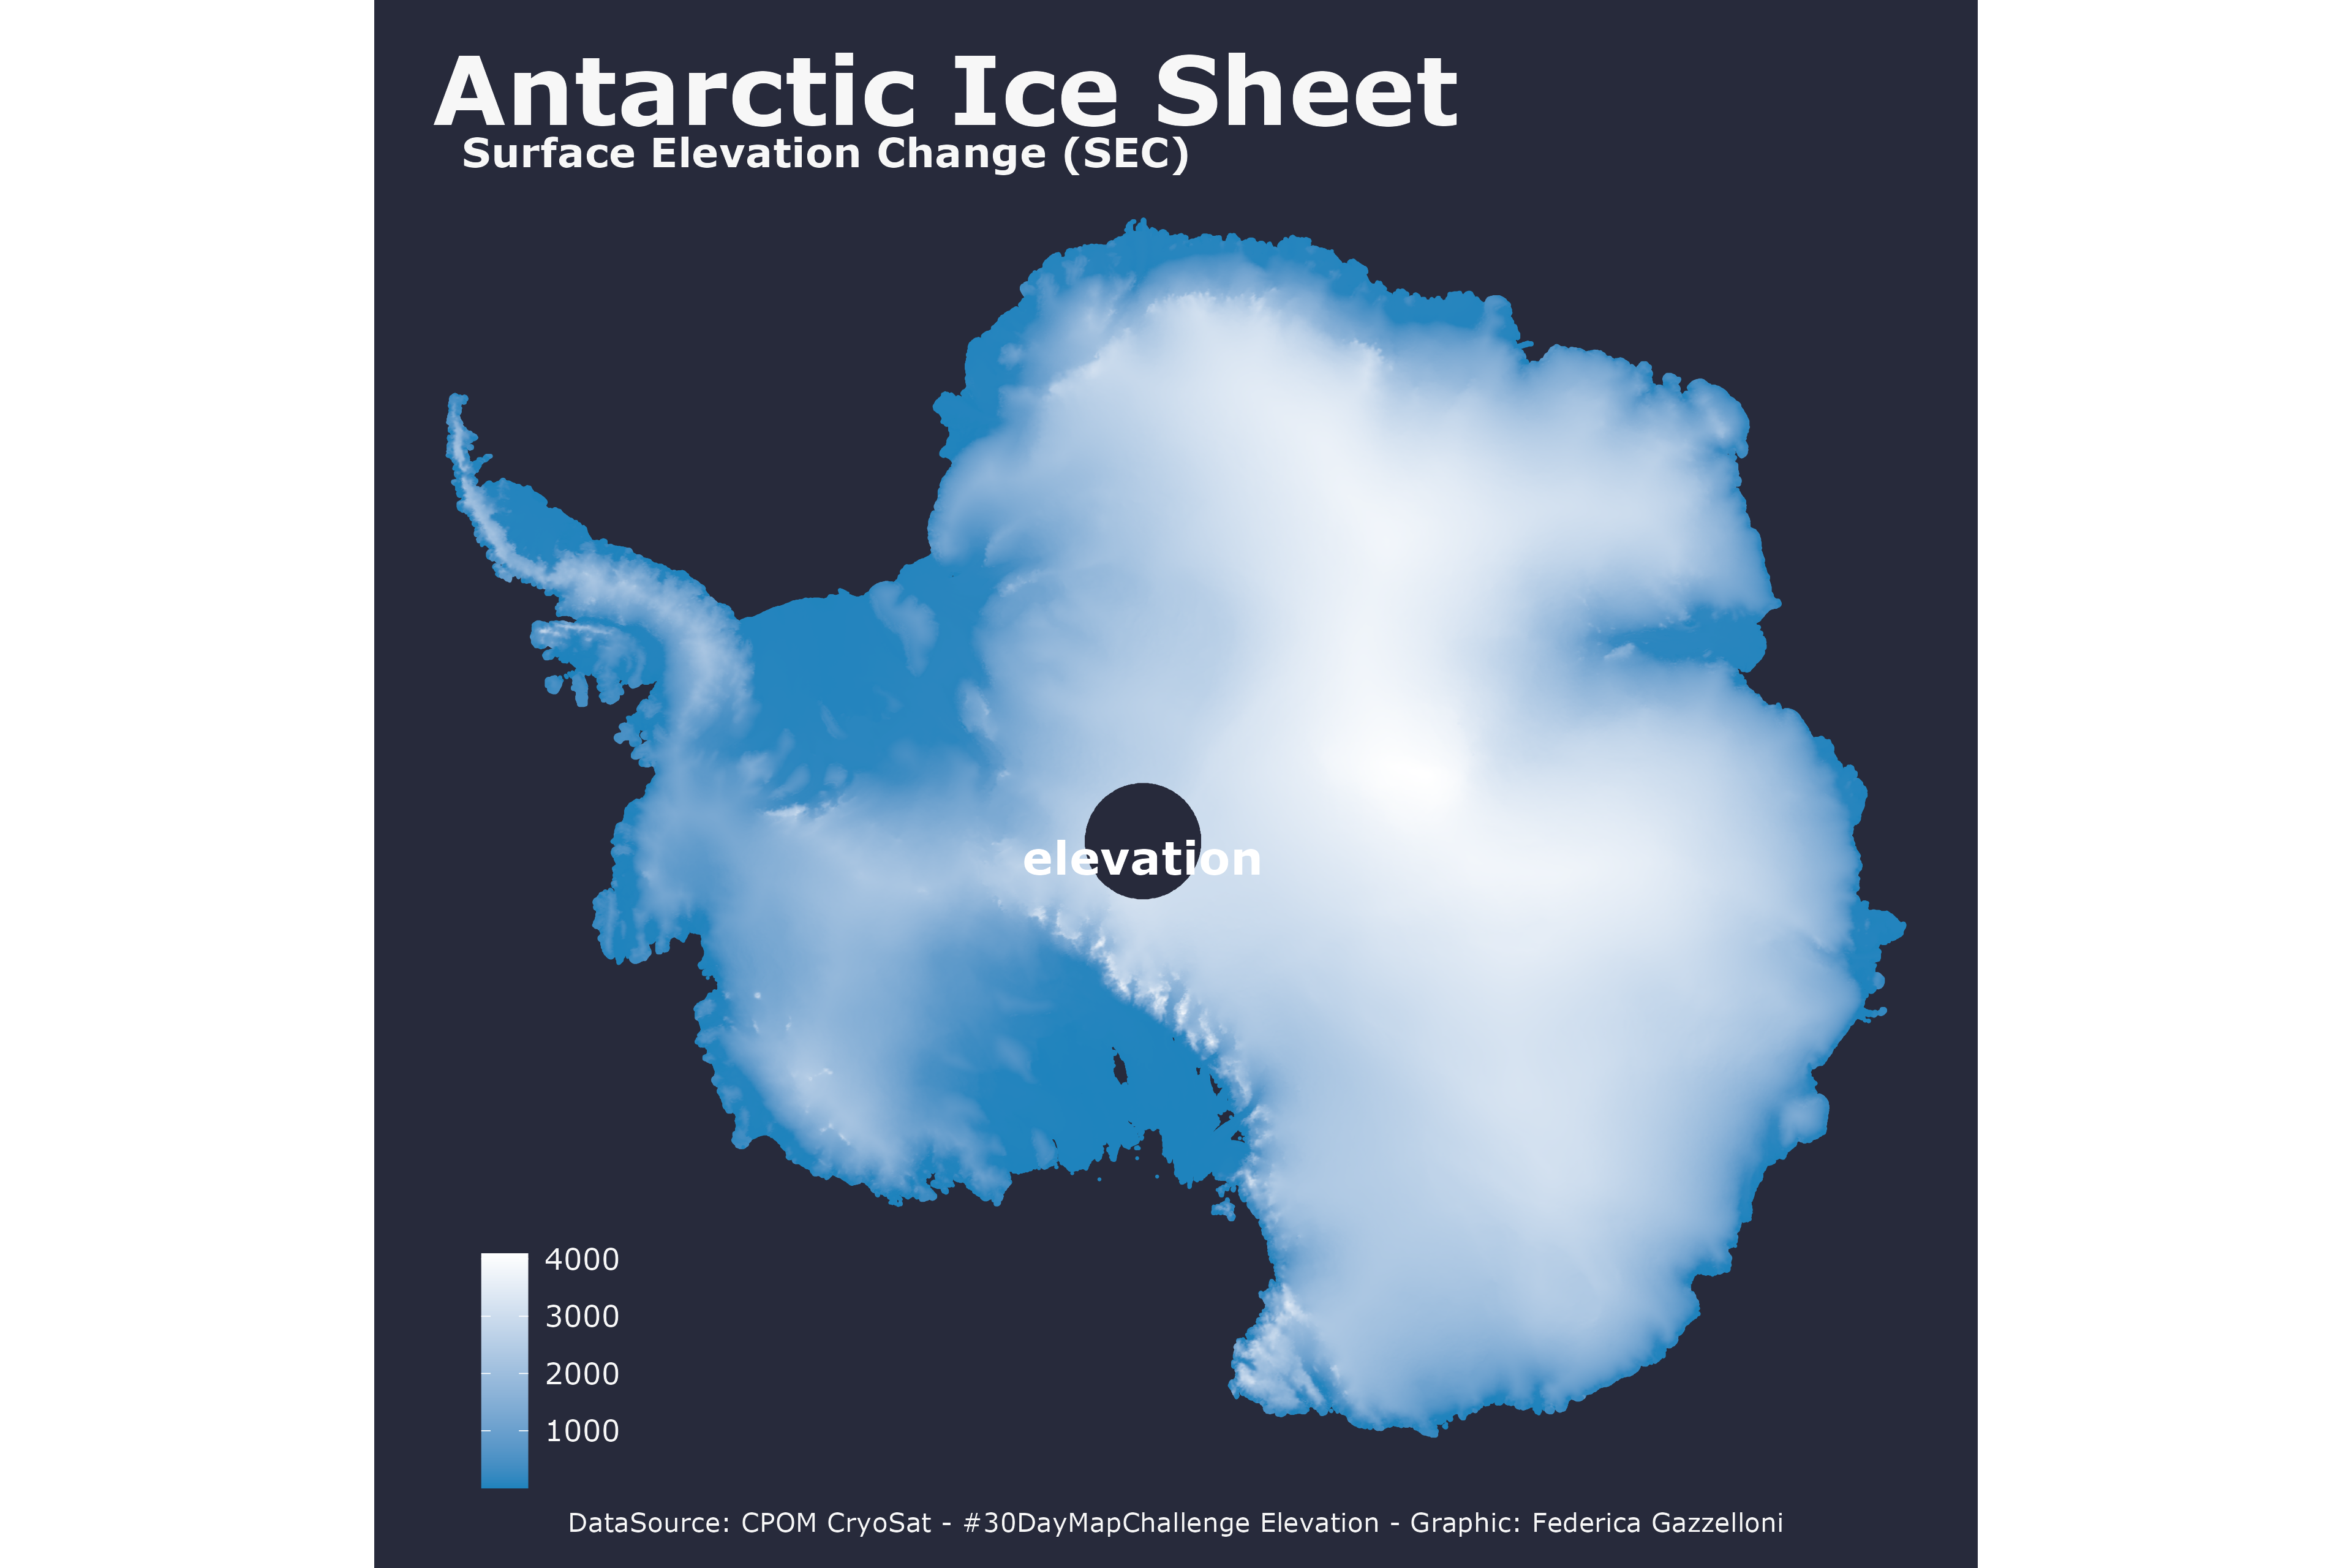
Surface Elevation Change (SEC)
CPOM CryoSat
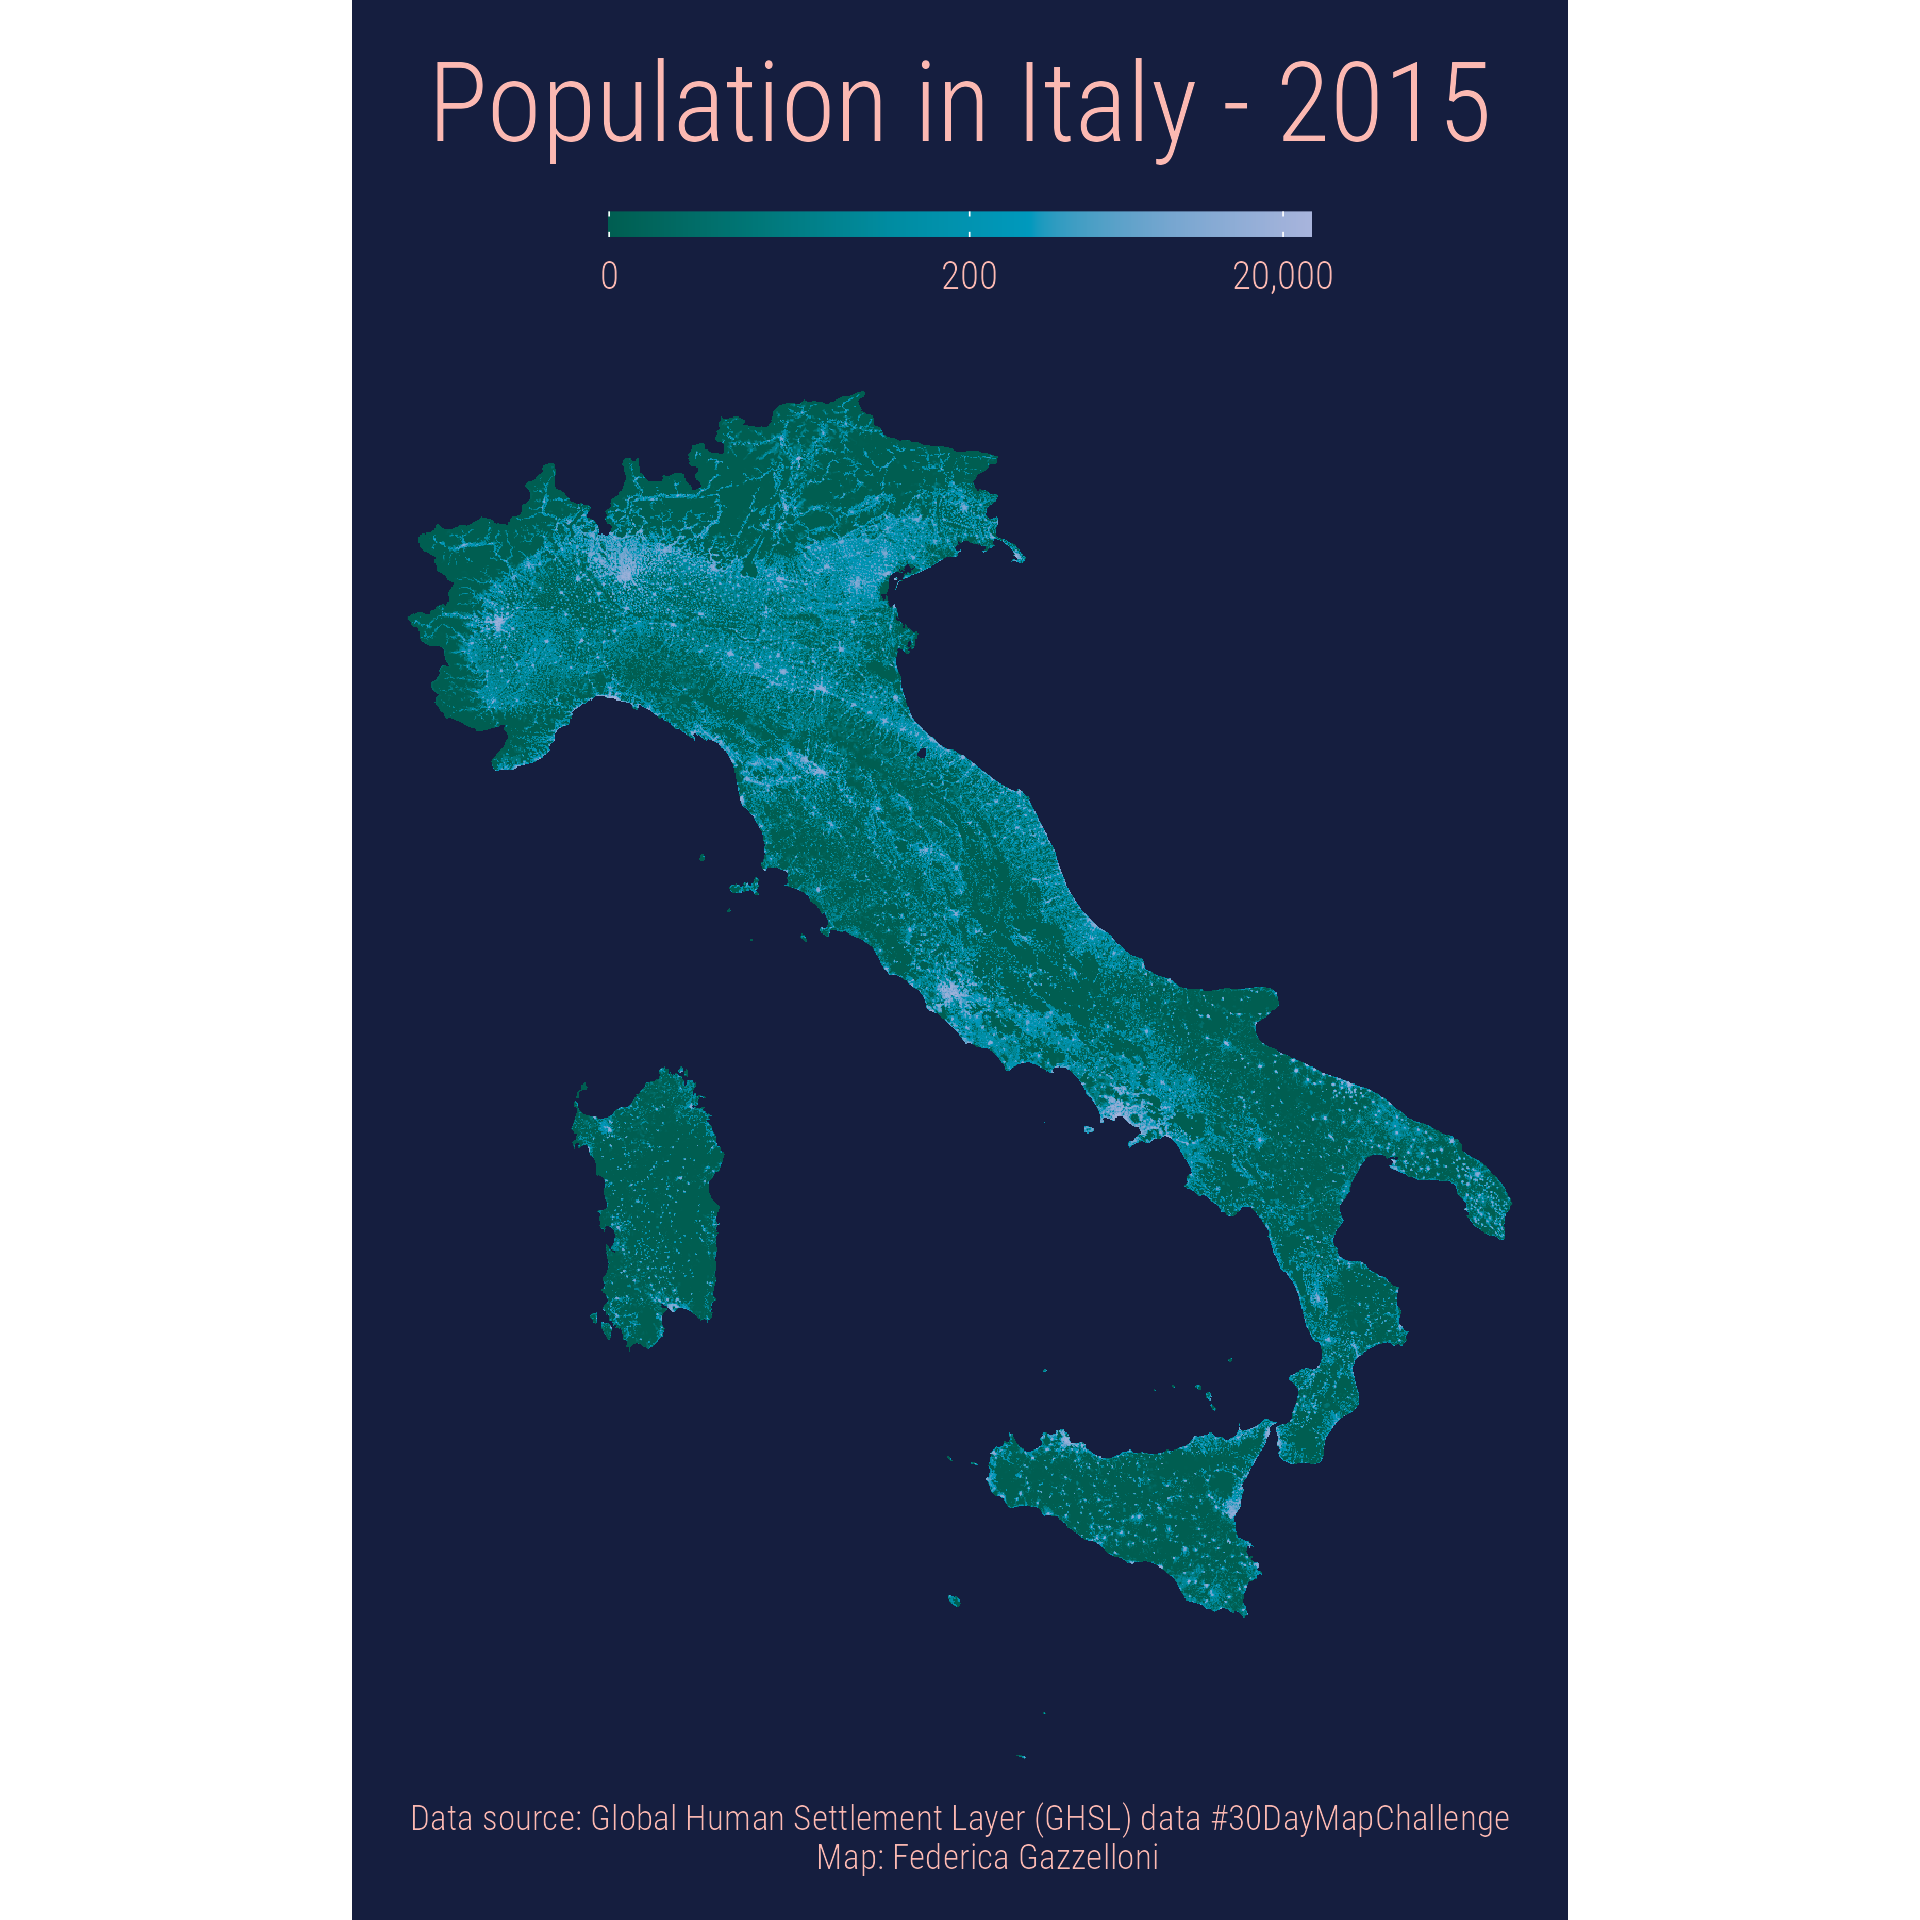
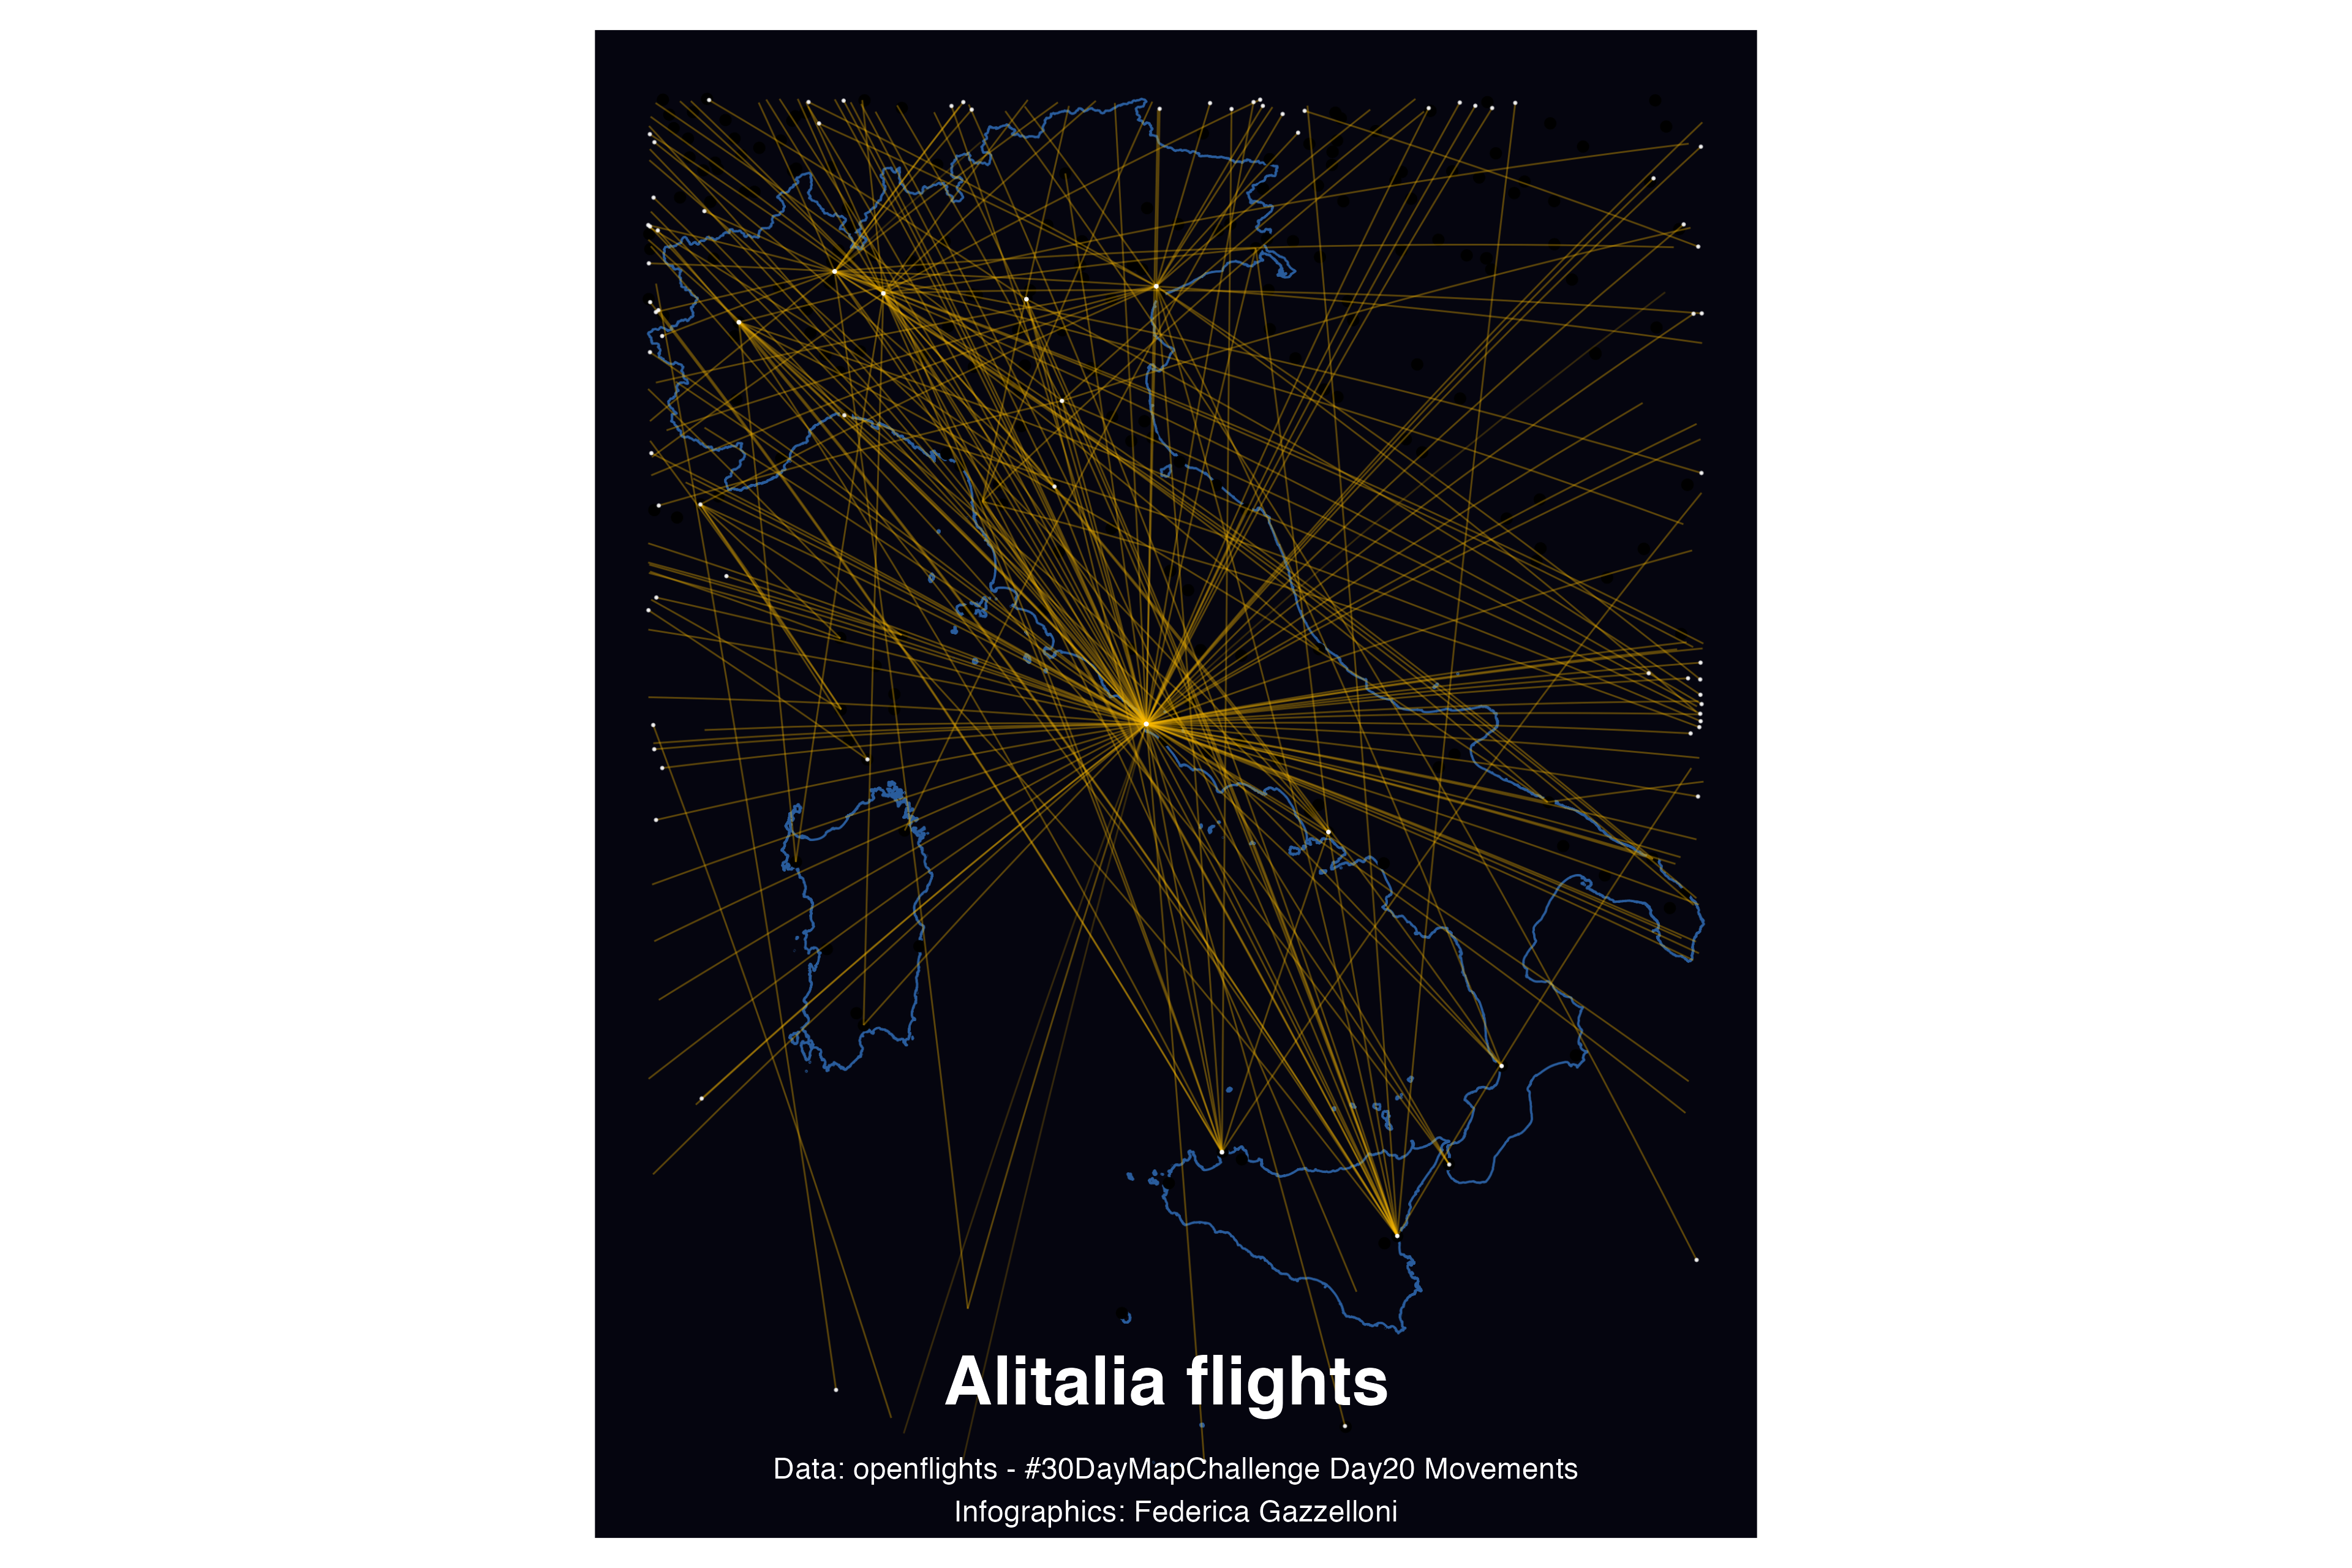
Italy
Alitalia Flights
openflights
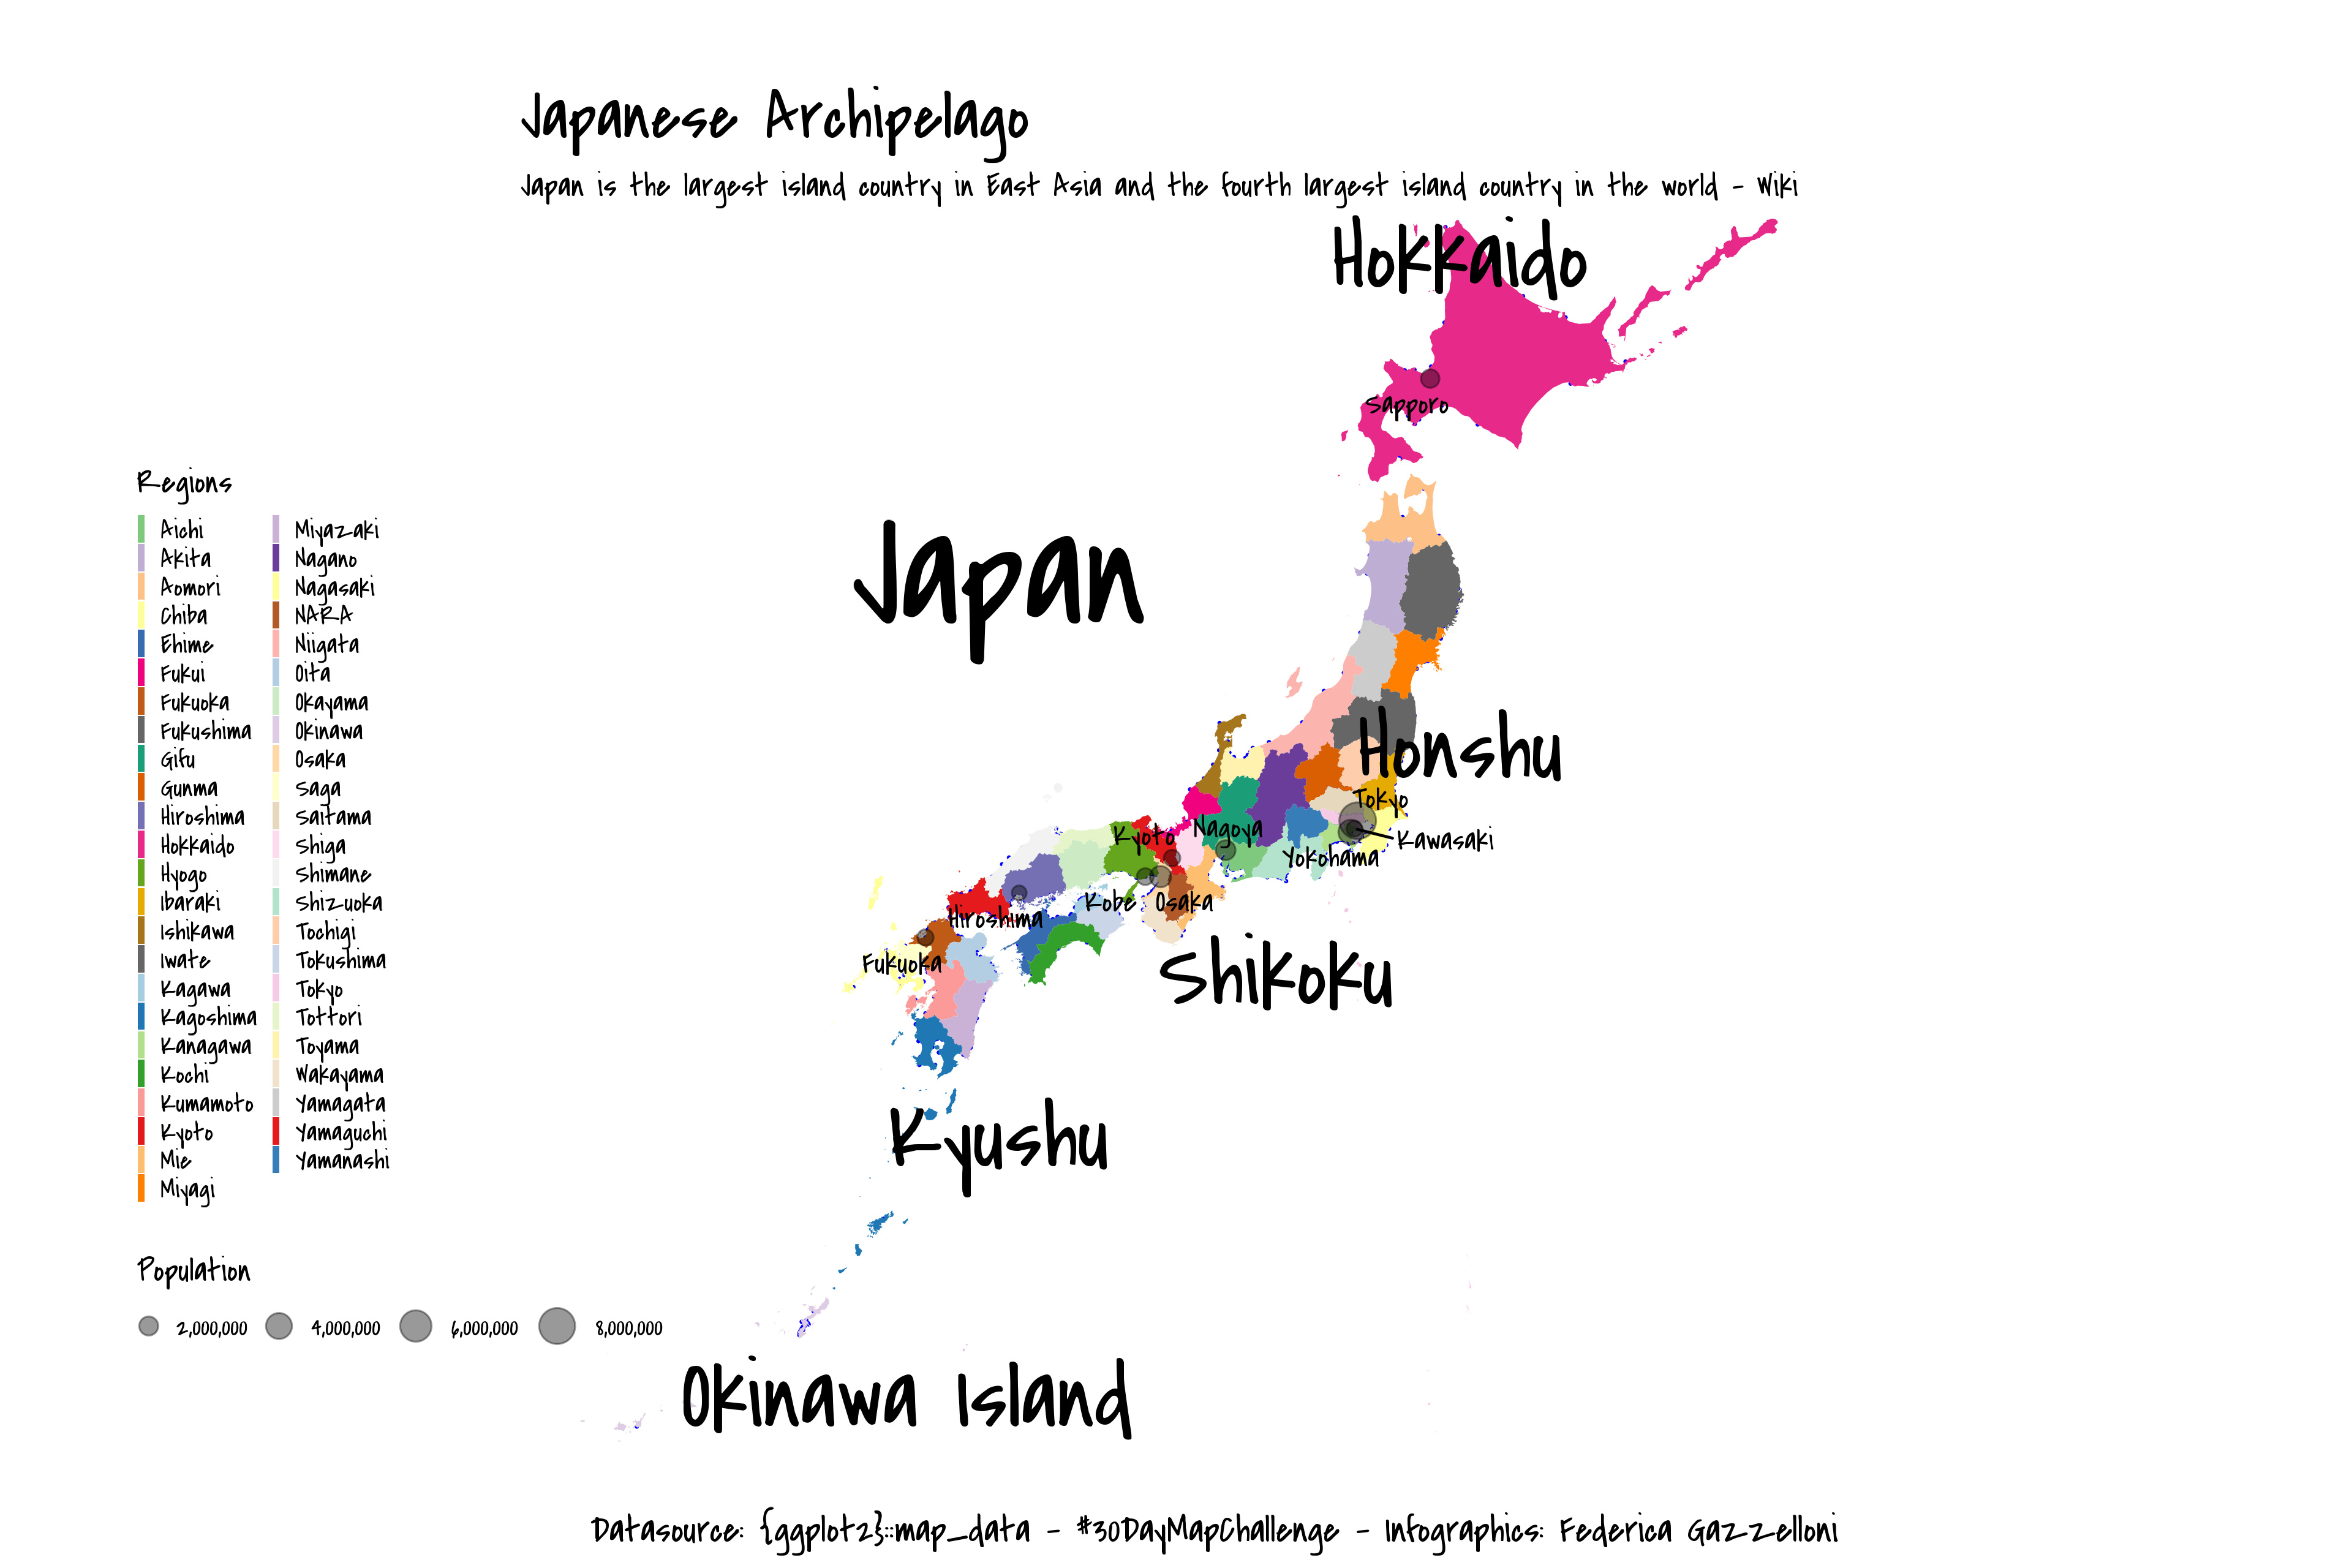
Japan
mapdata::get('world.cities')
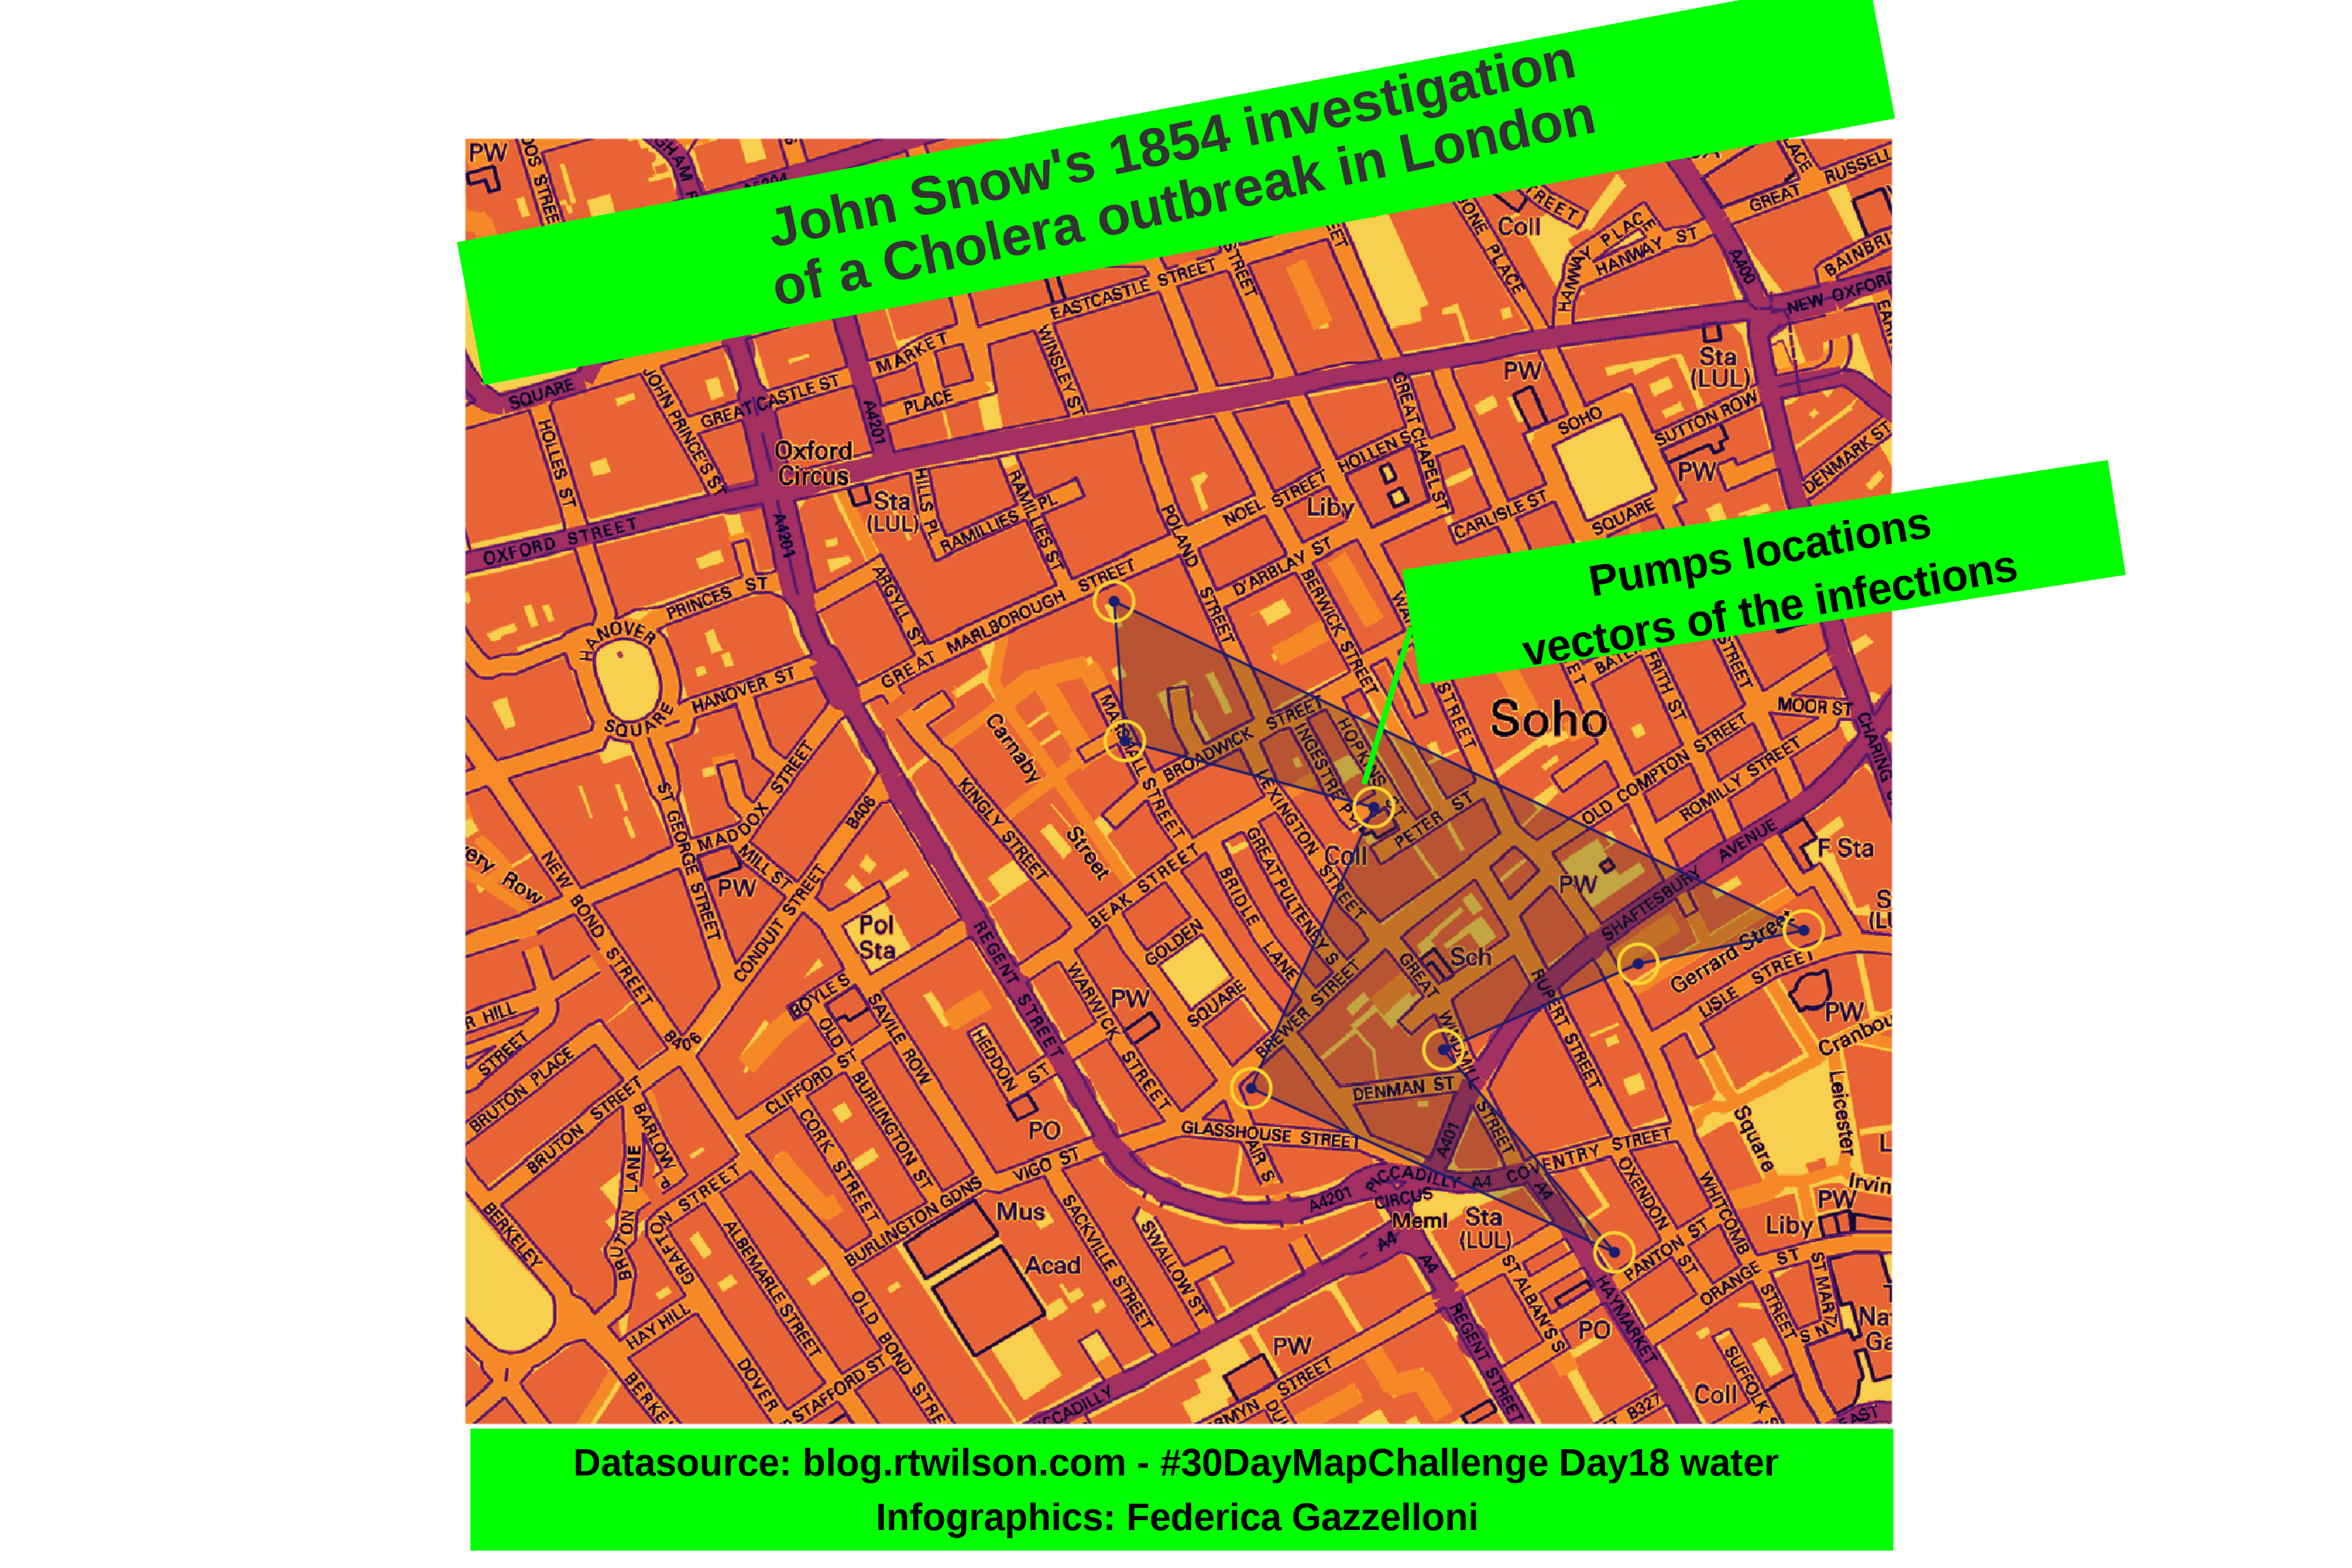
John Snow data
read_stars()
blog.rtwilson.com
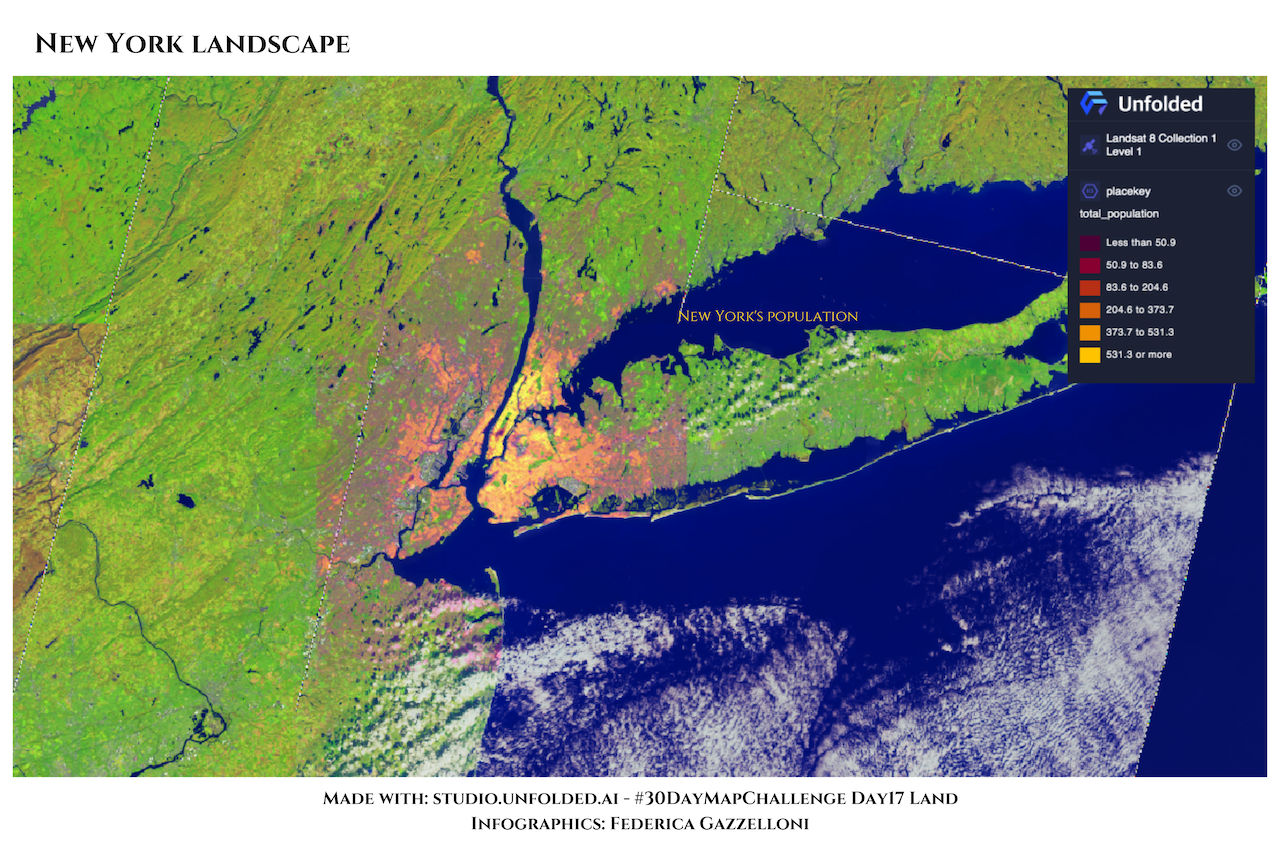
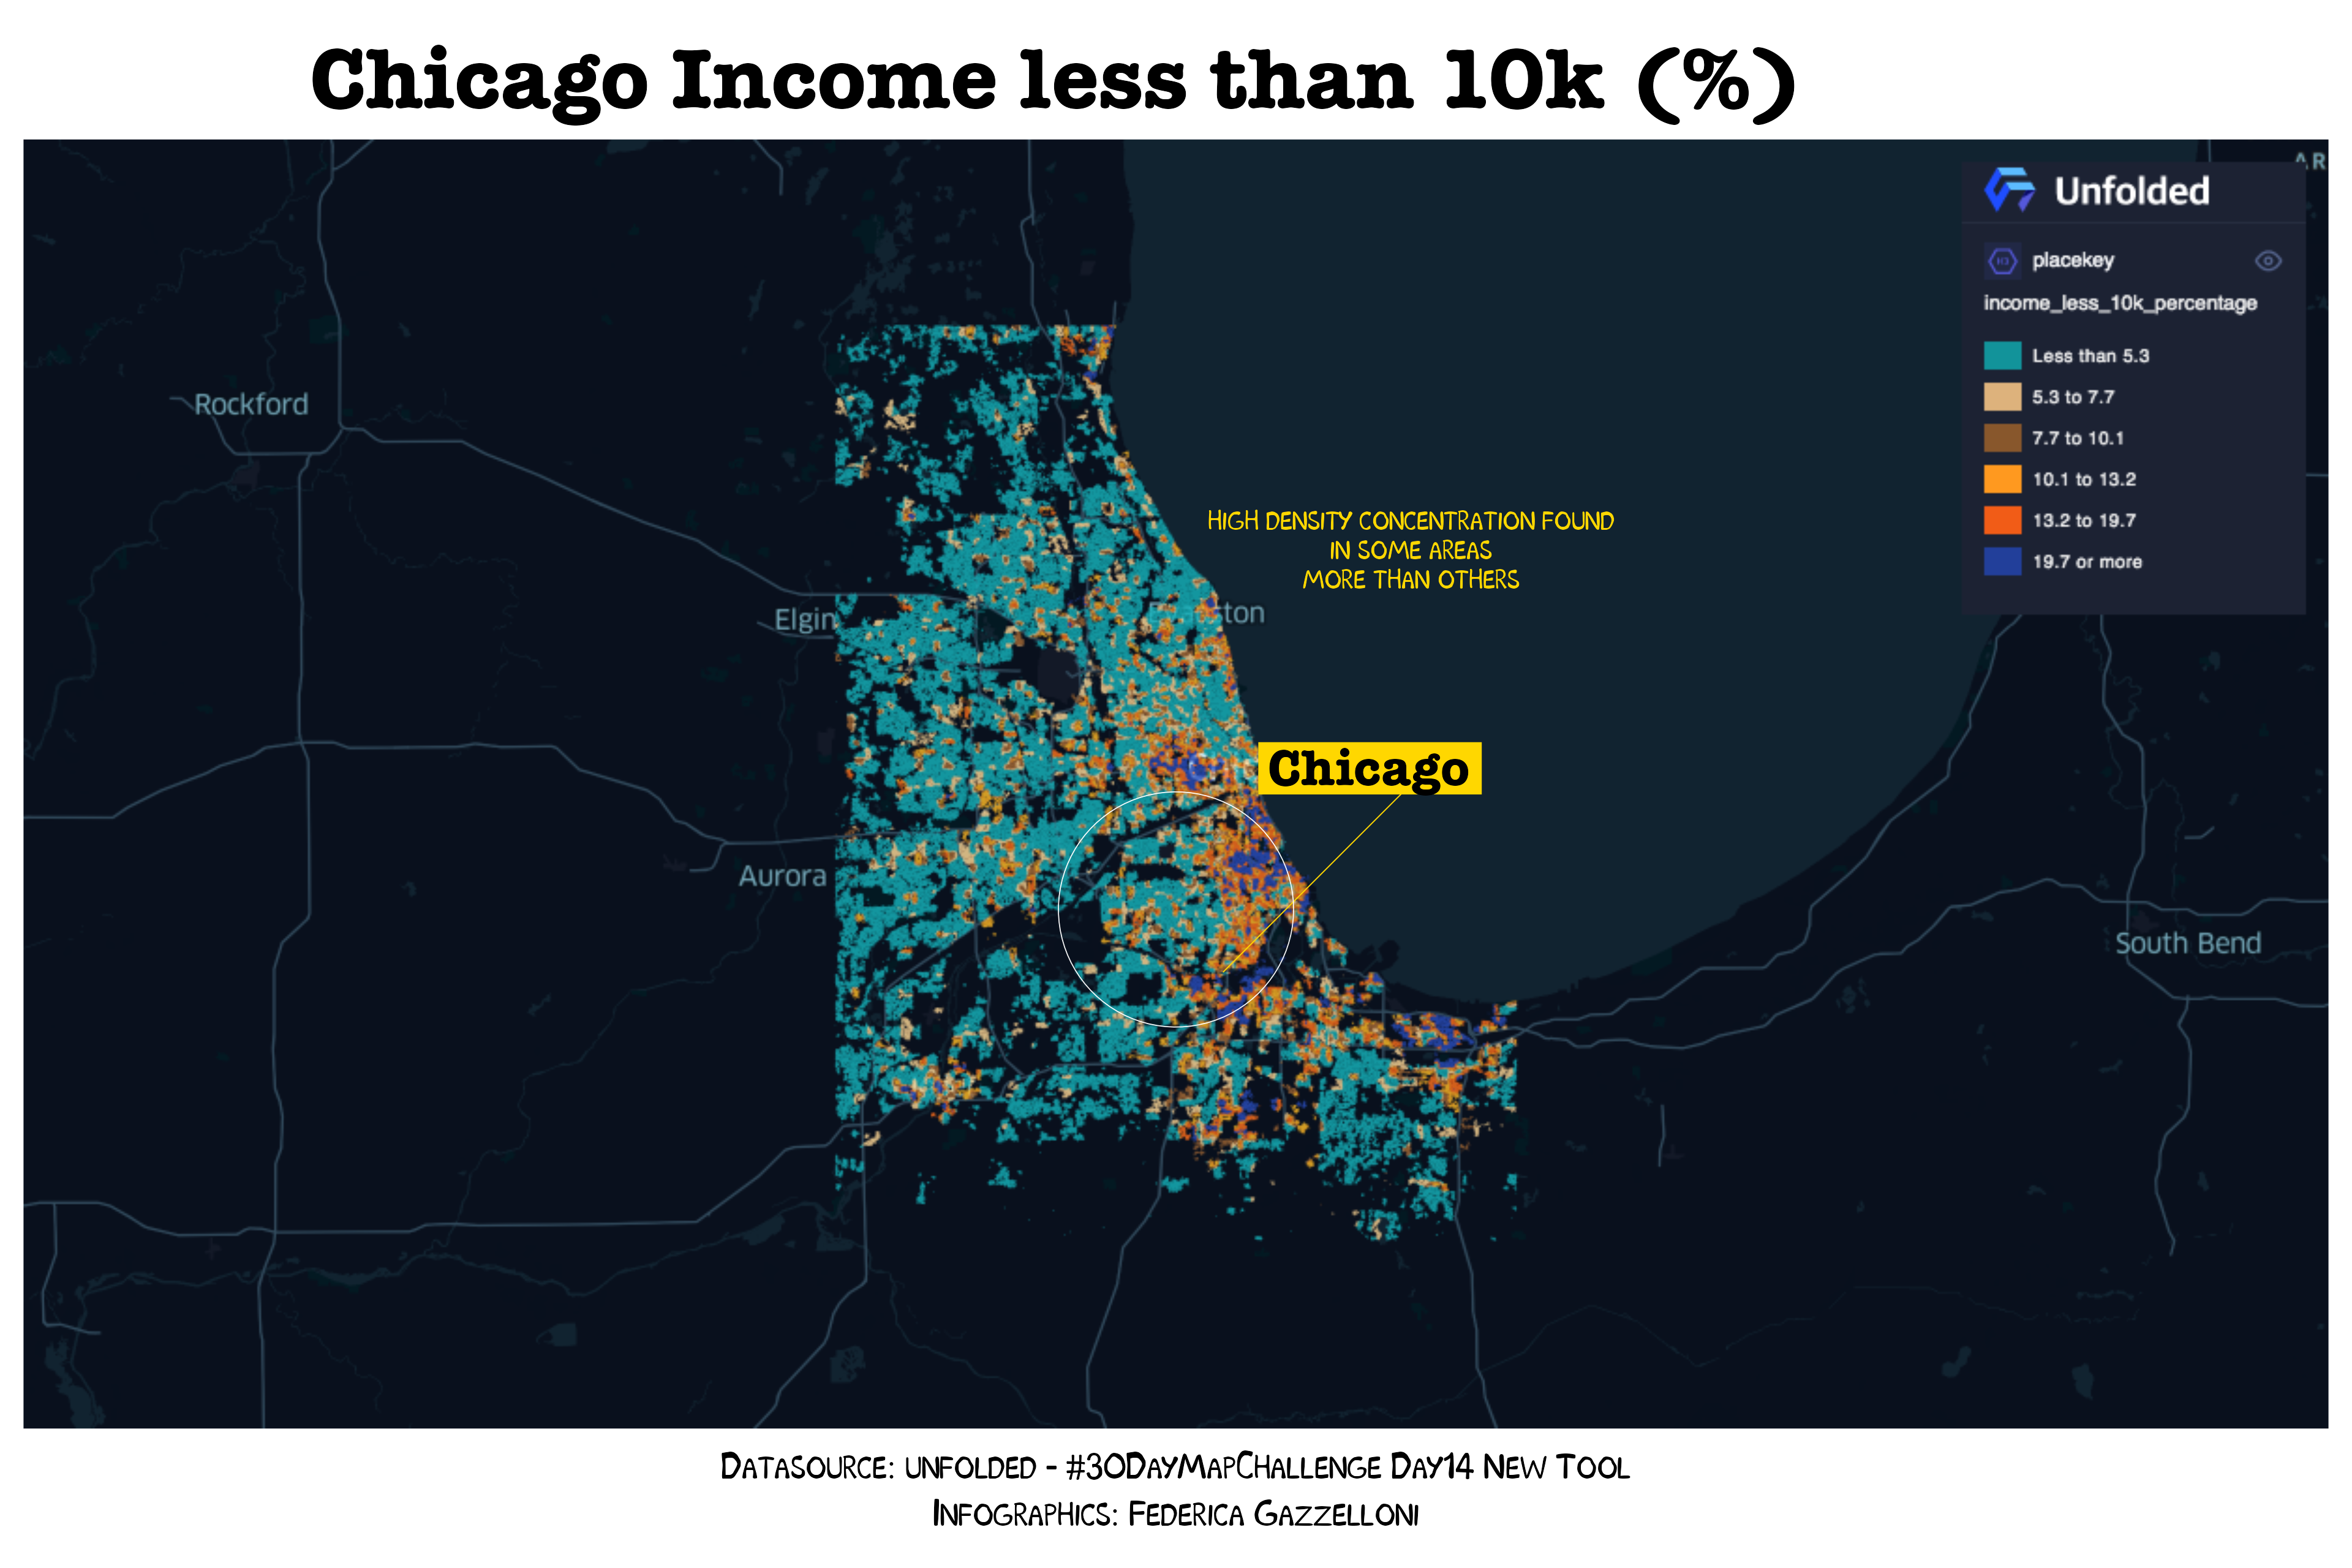
New York's population
Studio Unfolded AI
R
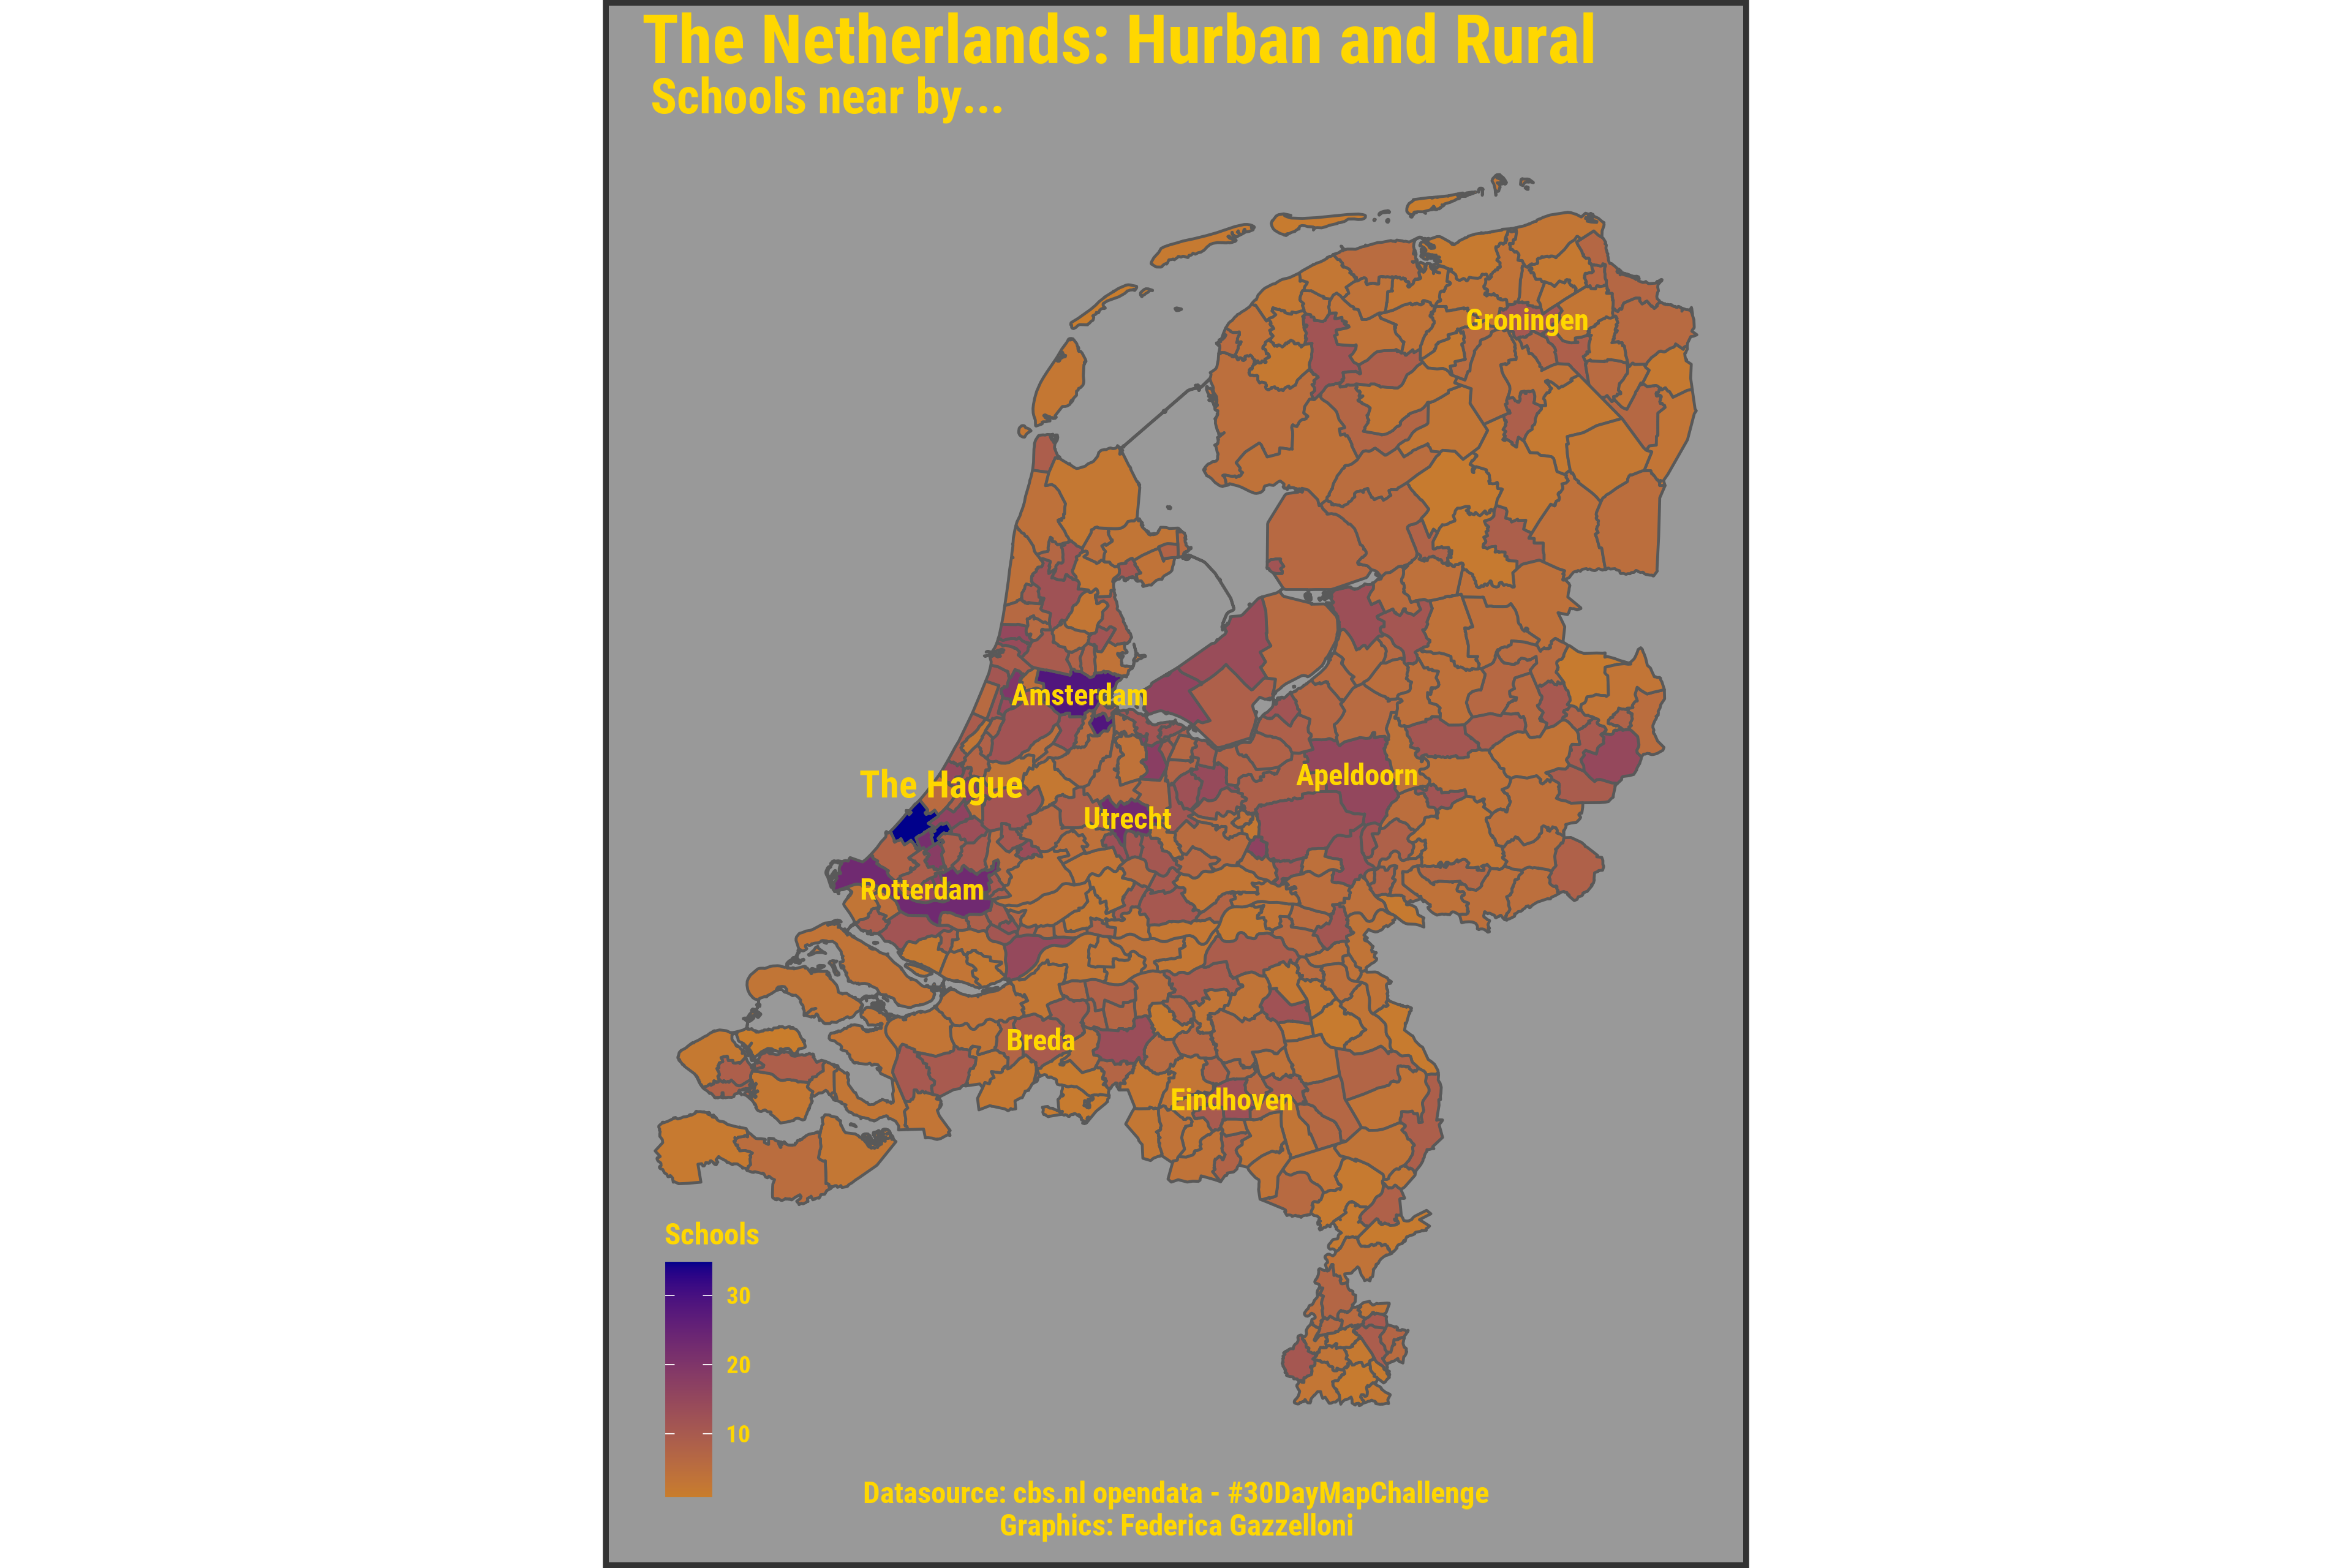
The Netherlands: Hurban and Rural
Schools near by...
cbs.nl
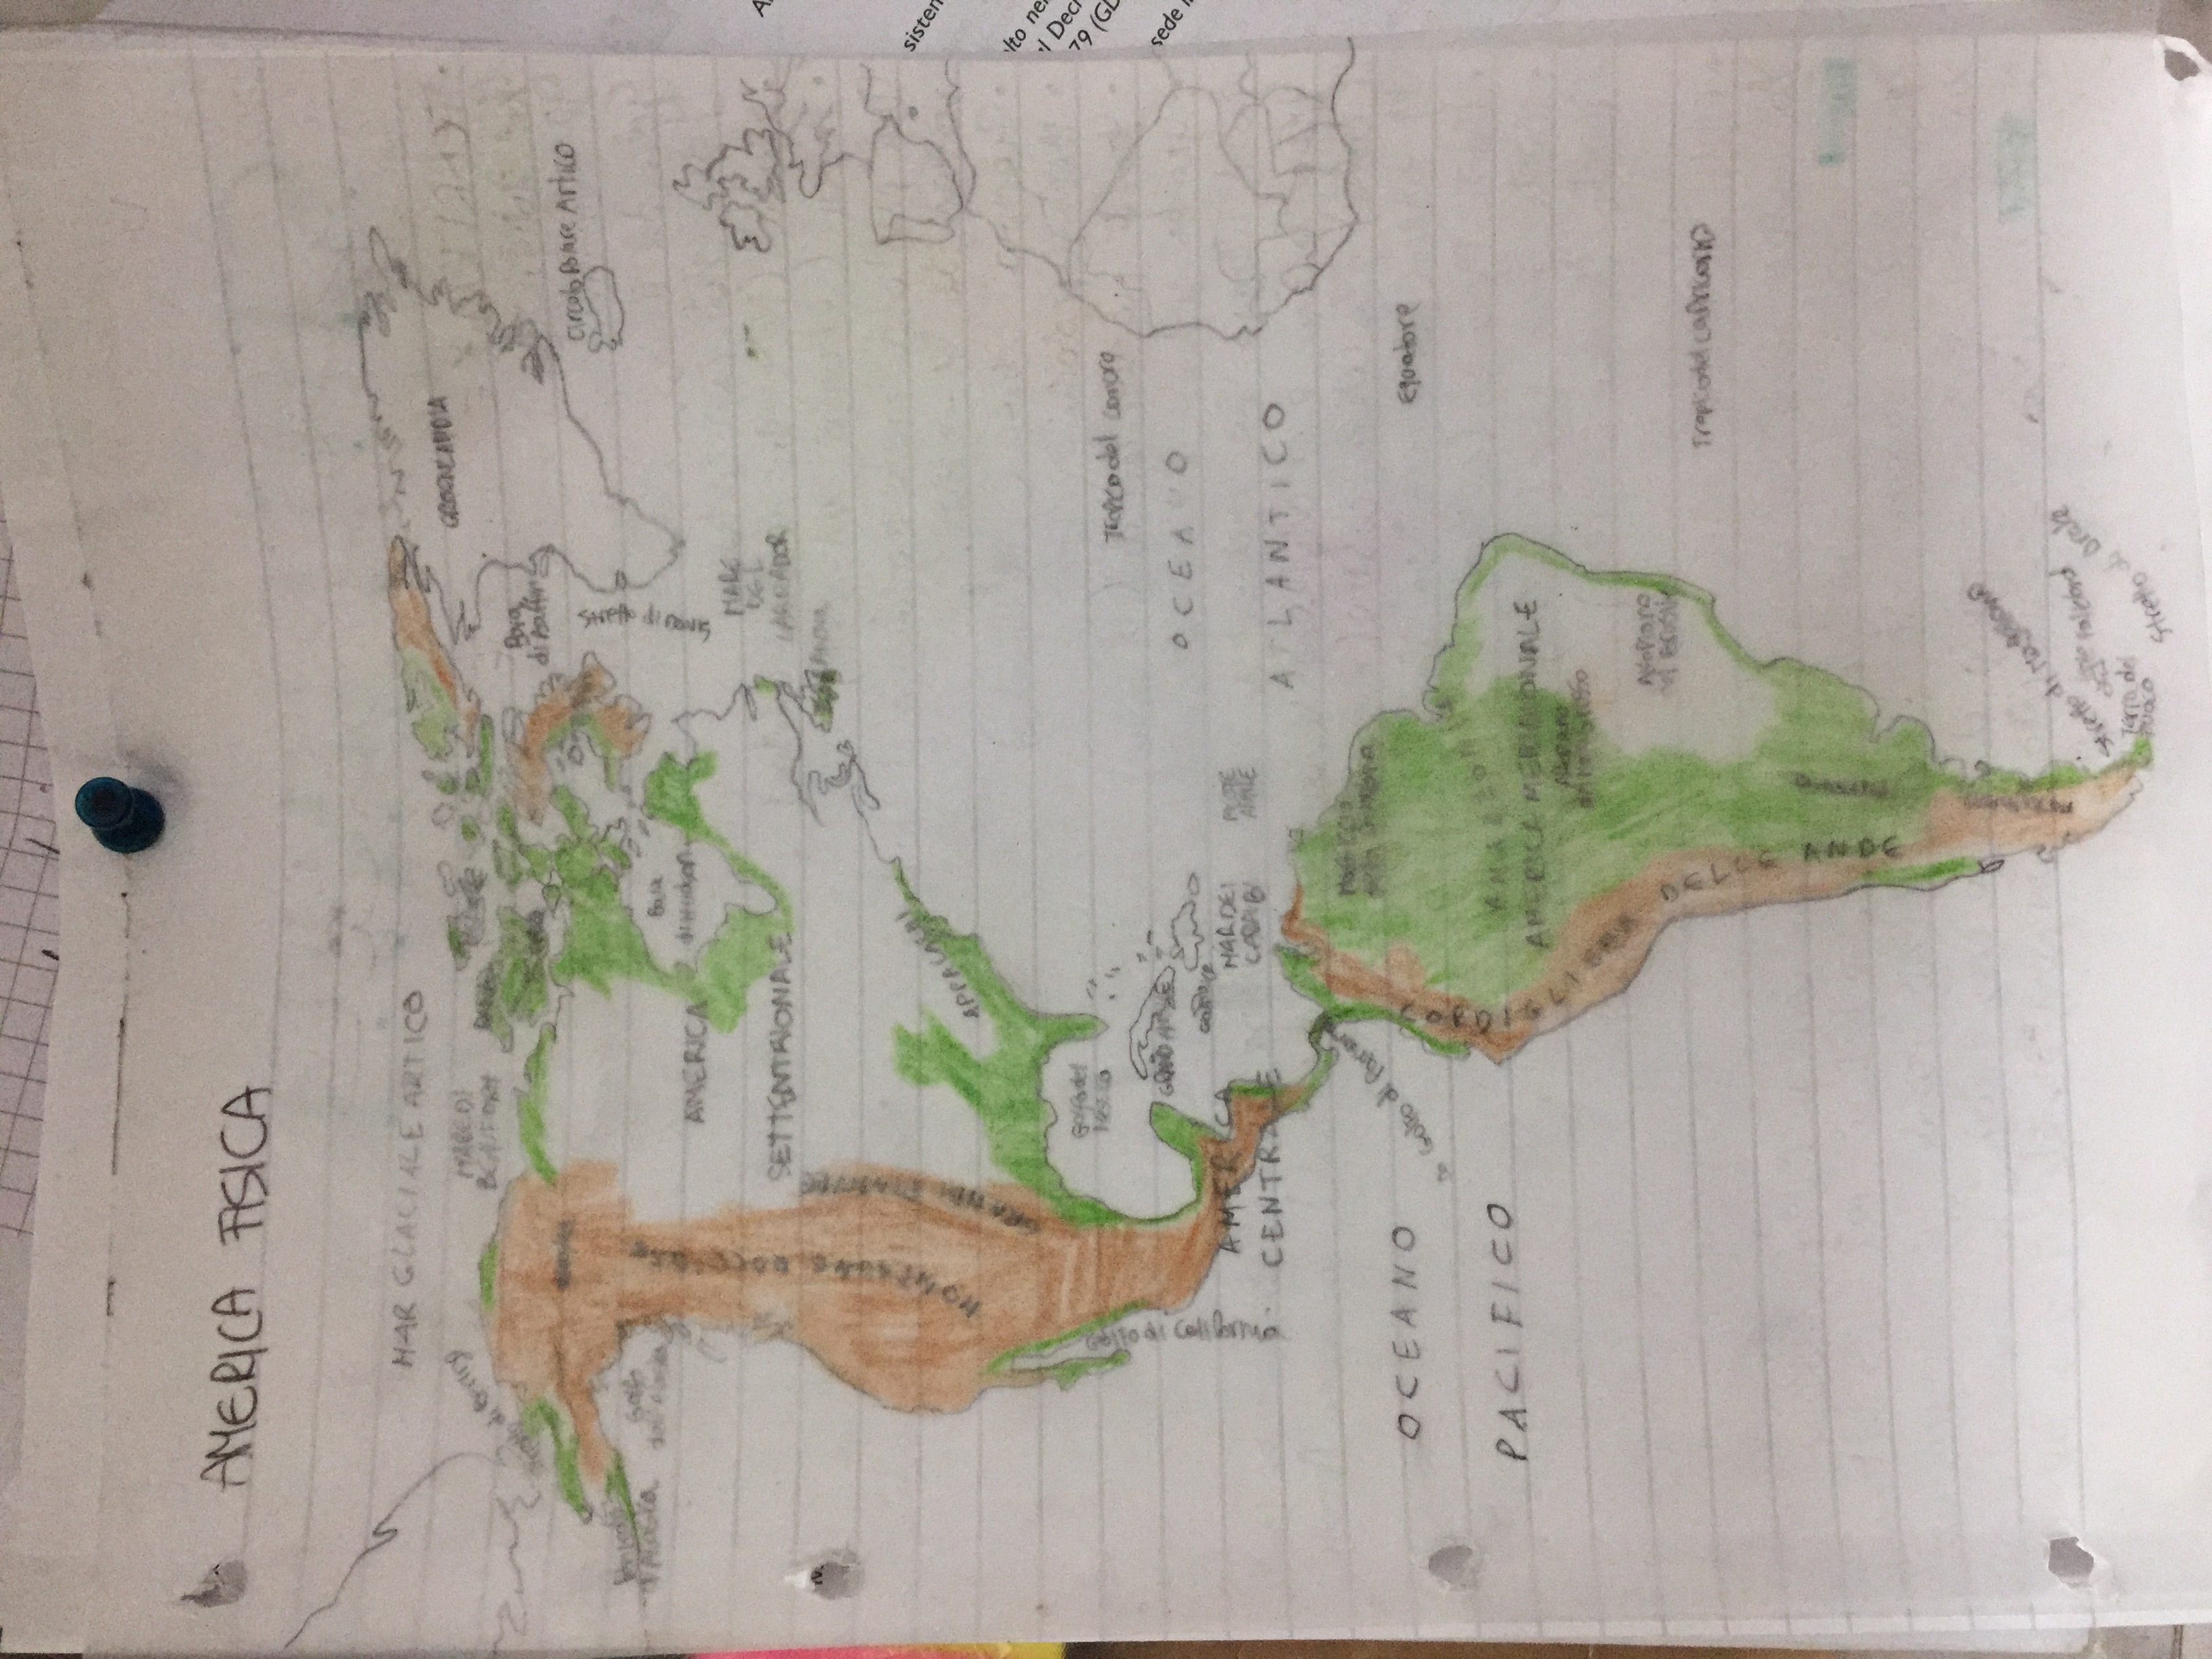
America
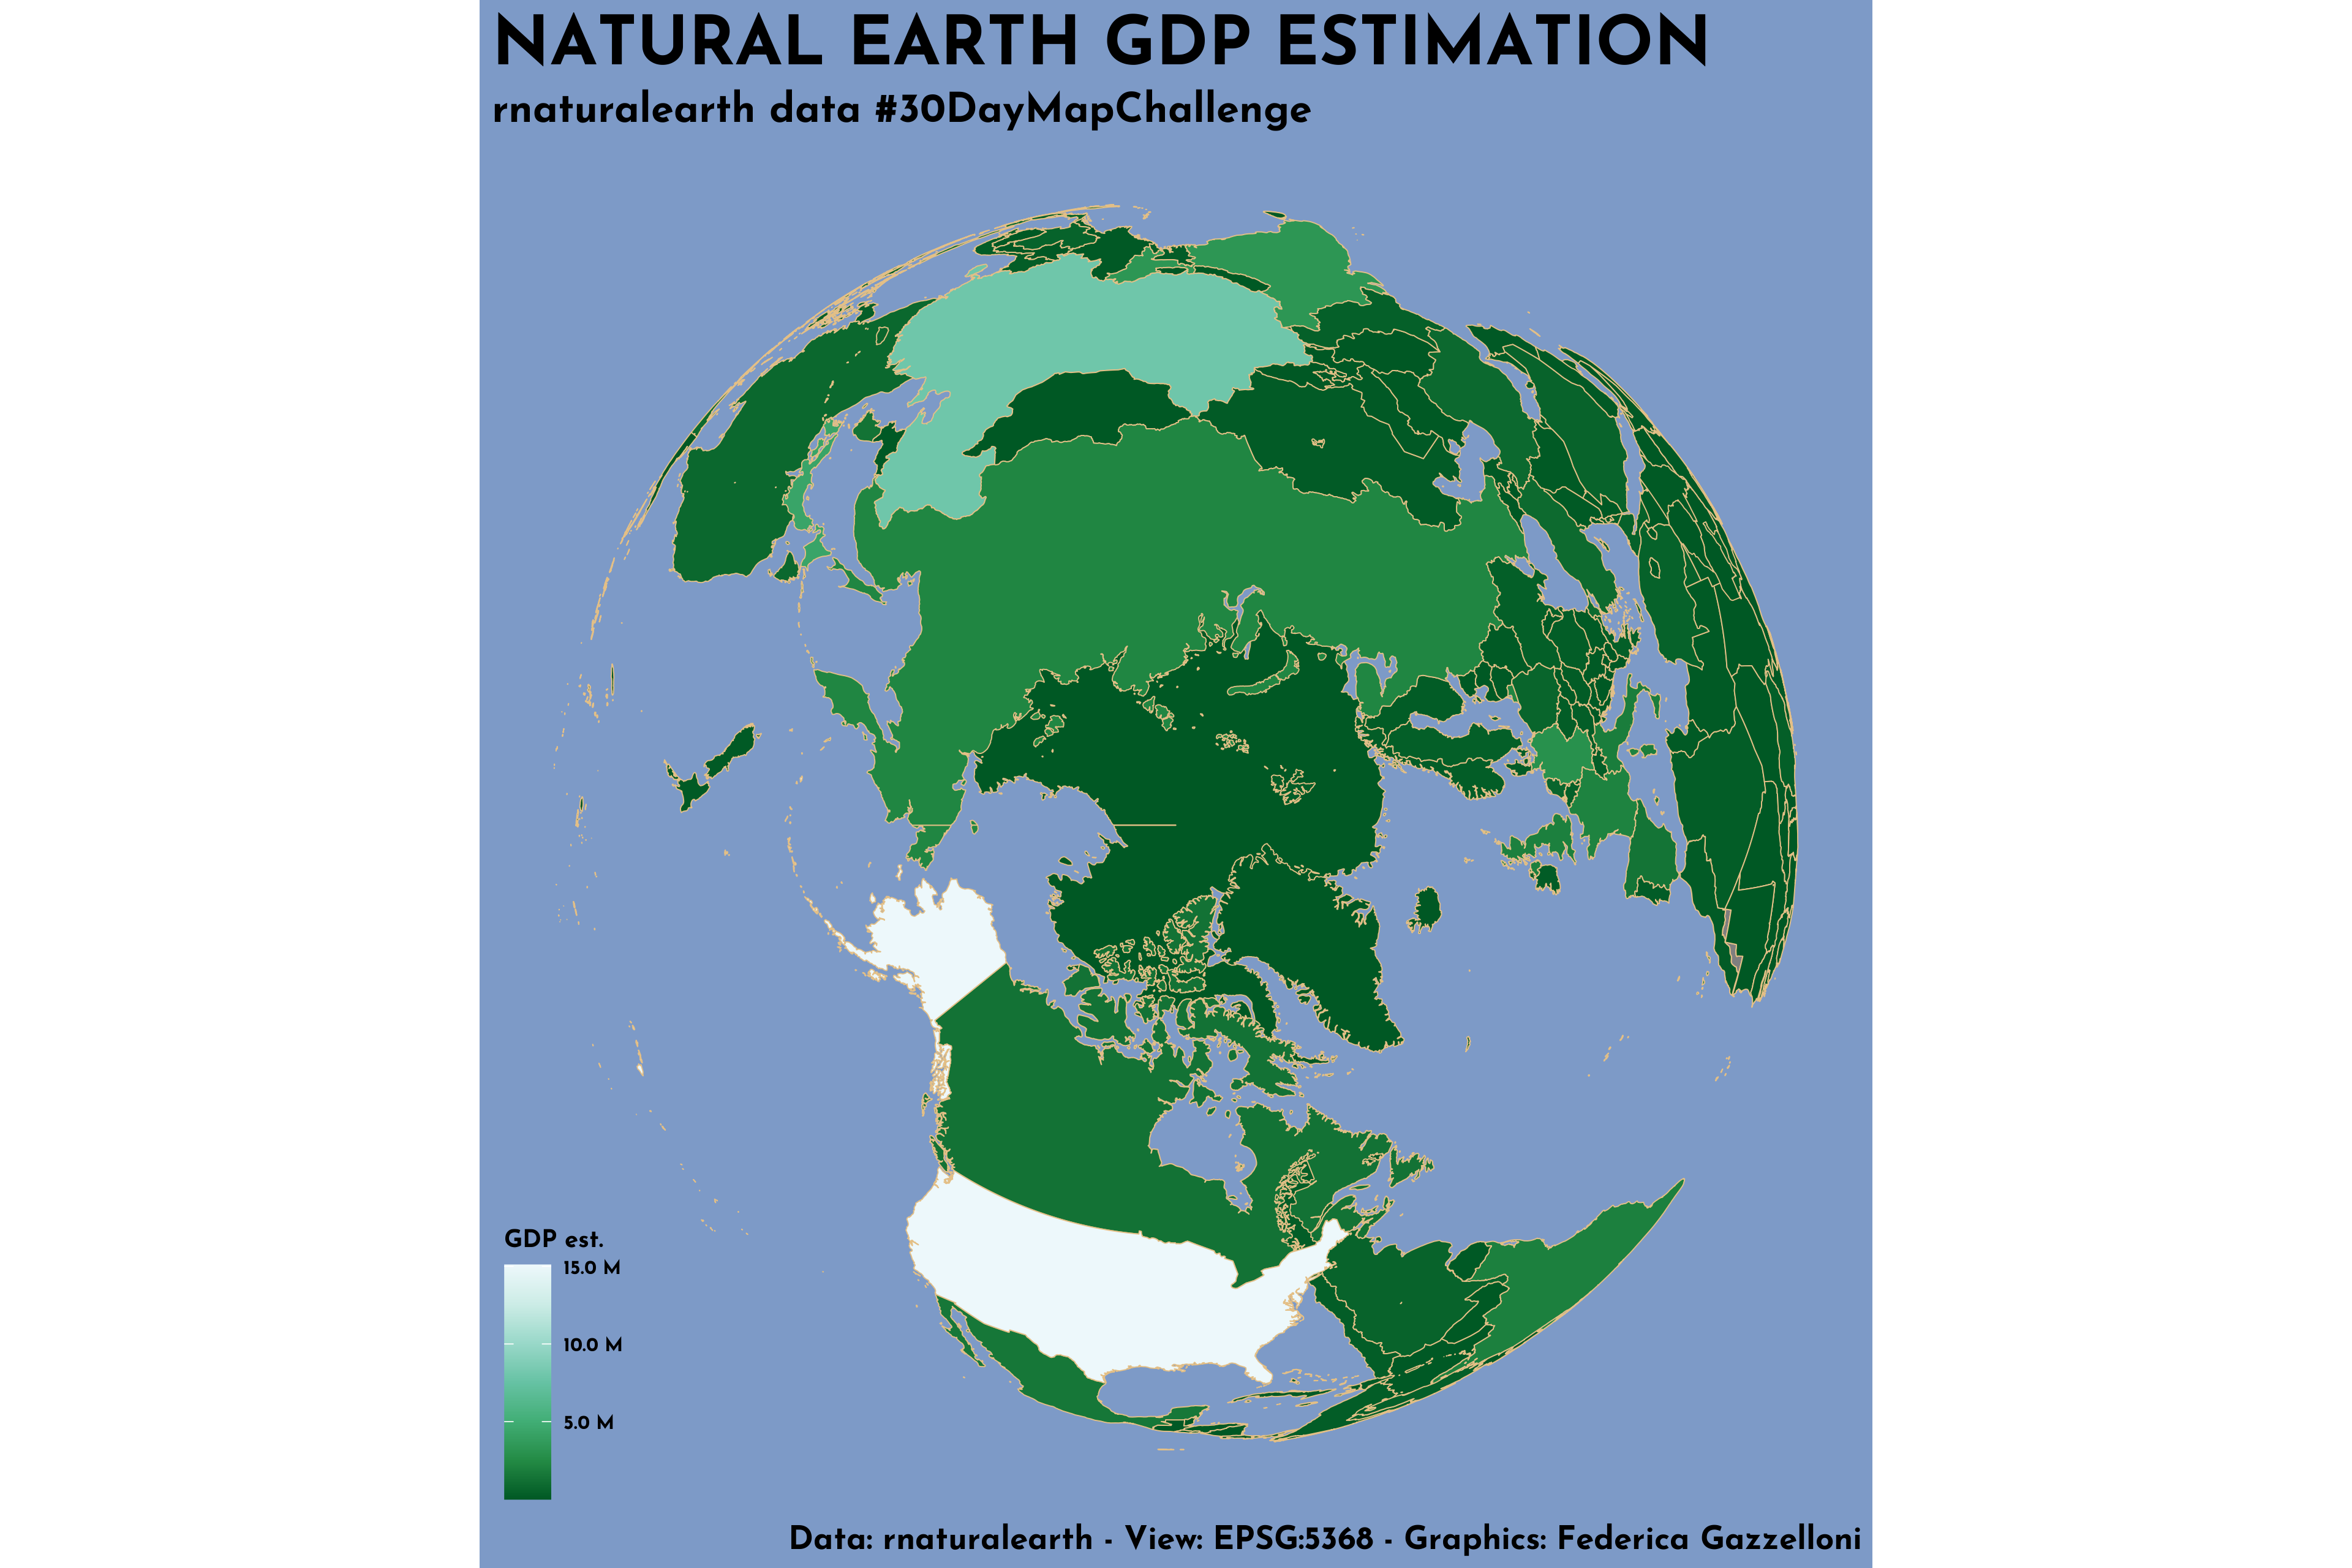
NATURAL EARTH GDP ESTIMATION
{rnaturalearth}
World Population 1950 vs 2030
World 3D map
Sat-view
bom.gov.au
{bomrang}
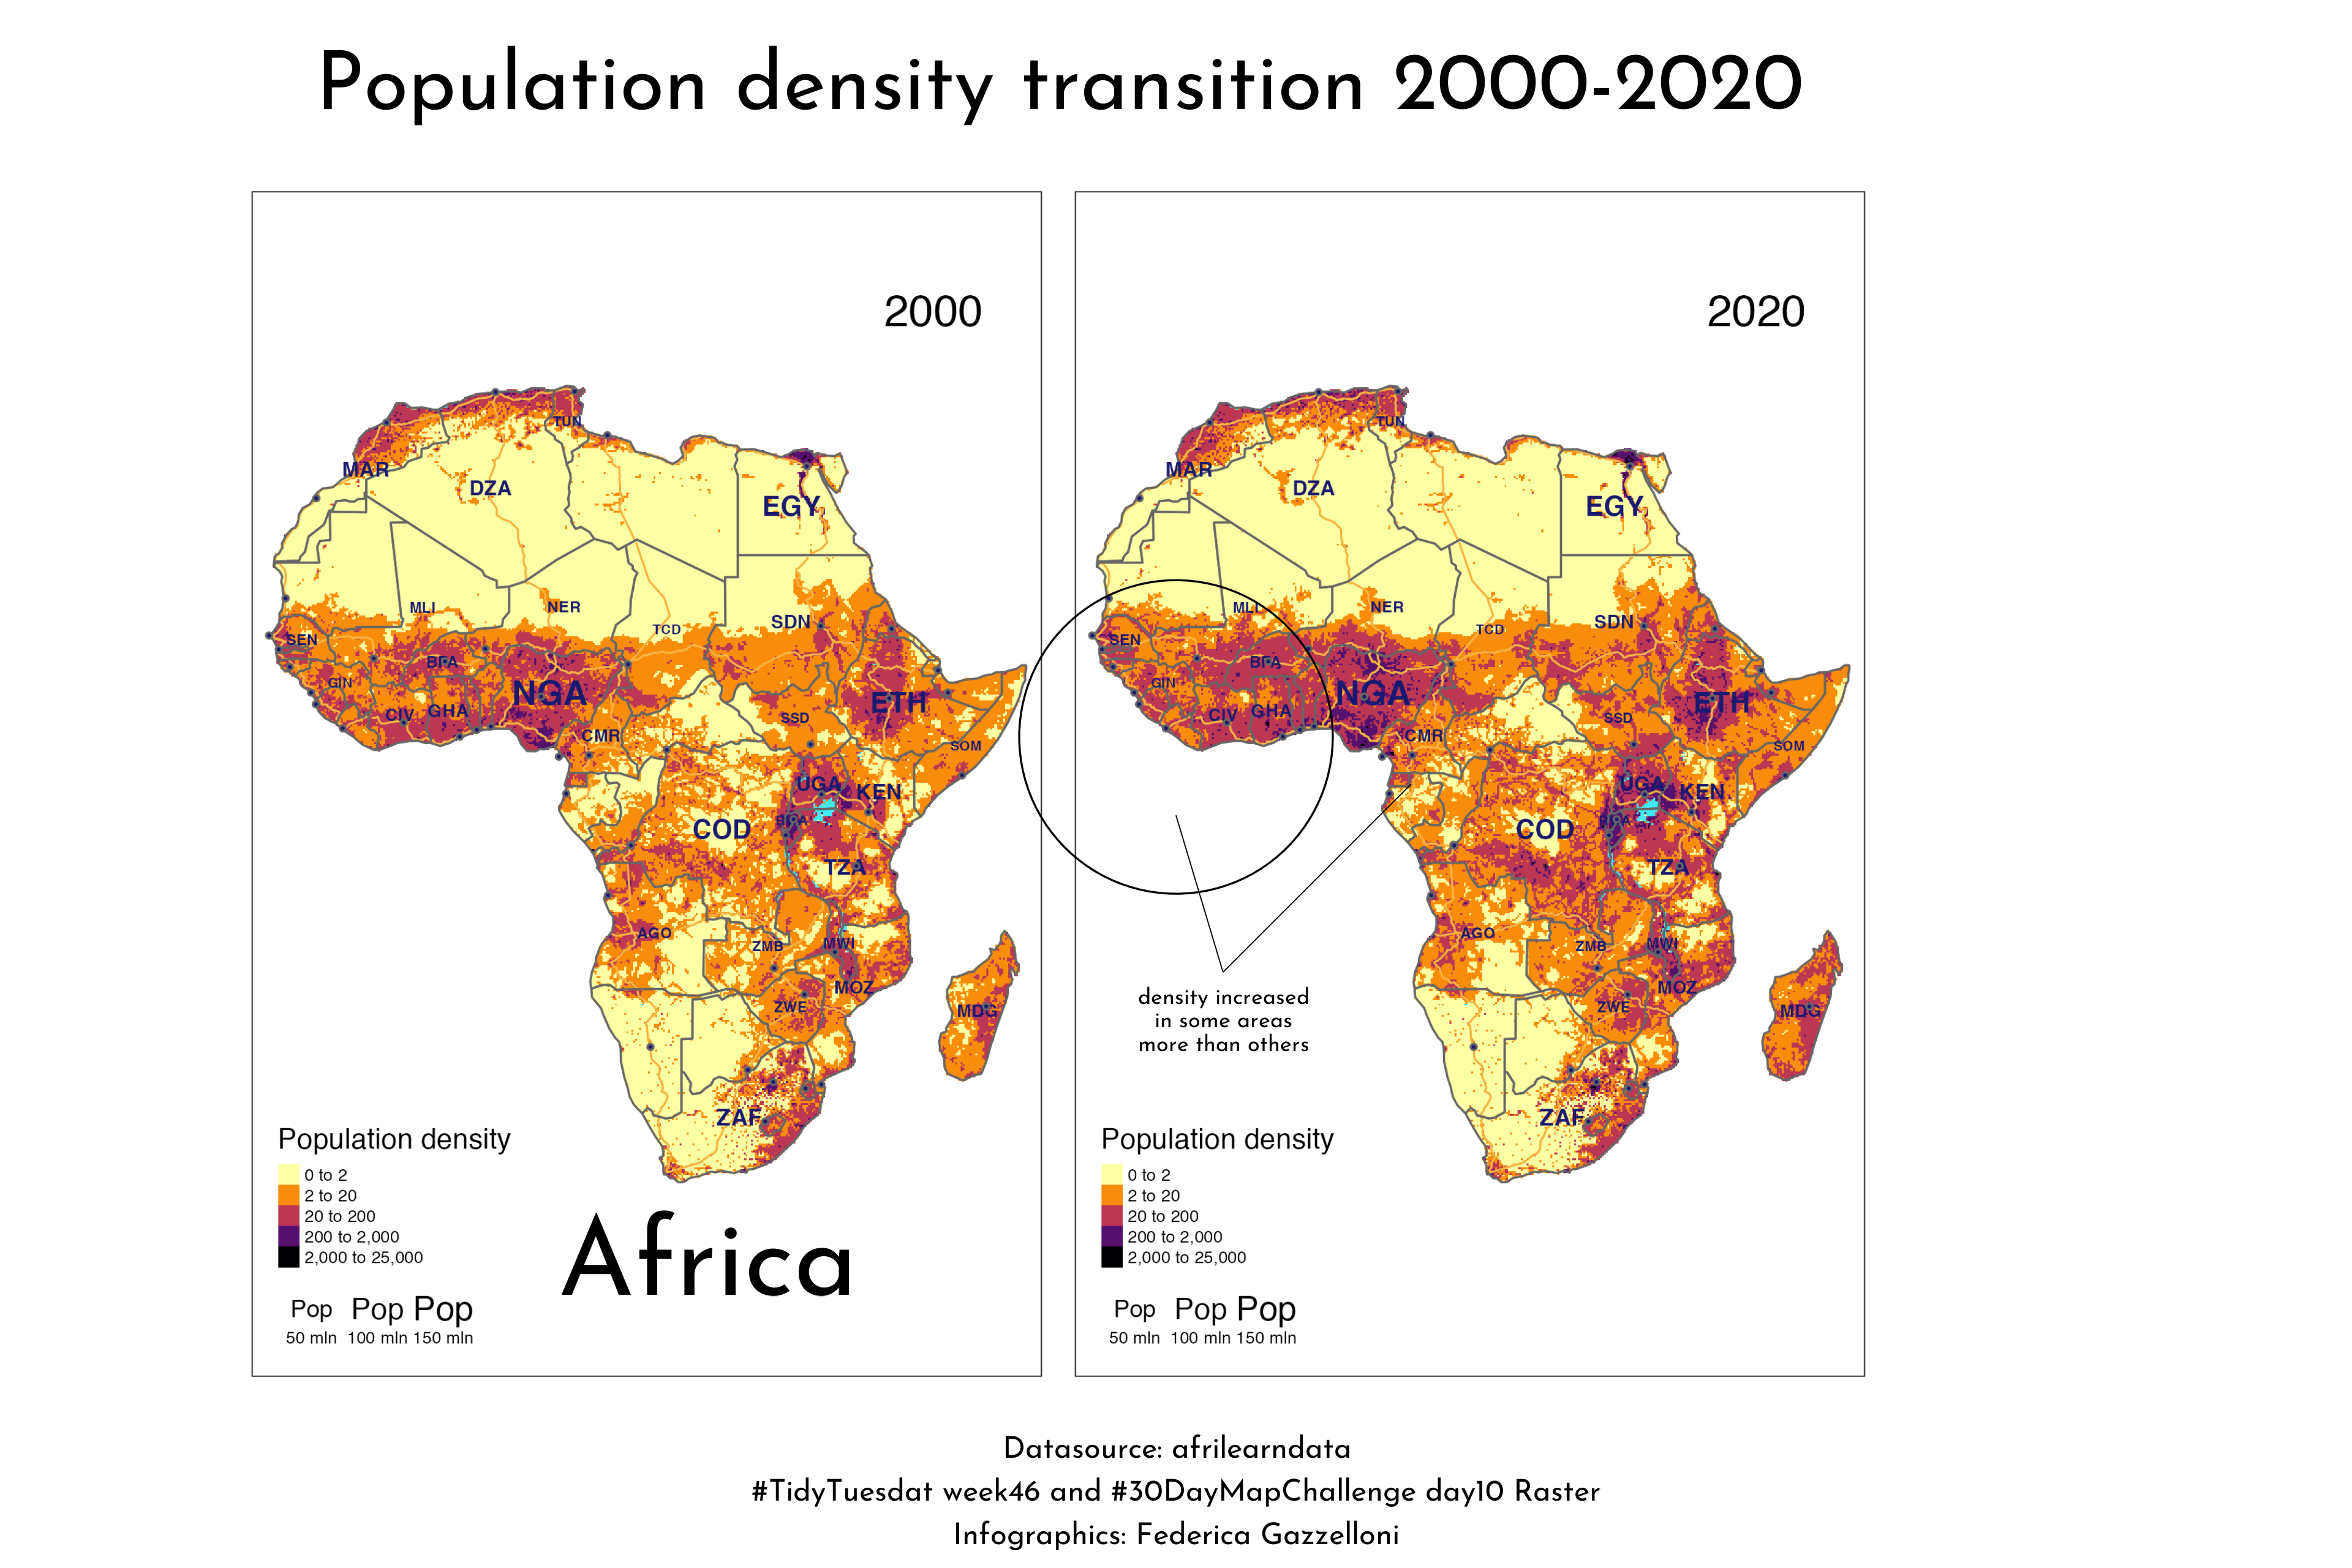
Africa Population transition 2000-2020
TidyTuesday
afrilearndata
{spData}
Globe Observer
Sat View of Australia
Australian Bureau of Meterorology
{ozmaps}
Greater London
US Drought map
Berlin water
{osmdata}
Boston
Isole Åland
France
{maps}