library(tidyverse)
library(eurostat)
library(sf)
library(ggthemes)
library(rvest)
library(ggmap)Overview
Eurostat data with R. I used the {eurostat} package to shows European Child and Youth Population.
Load Libraries
Eurostat Geospatial
eu_geo <- get_eurostat_geospatial(resolution = 10,
                        nuts_level = 0,
                        year = 2016)

eu_geo %>%
  ggplot() +
geom_sf()search_eurostat("youth")Europe Youth Data
yth_demo_010 <- get_eurostat("yth_demo_010", time_format = "num")yth08_20 <- yth_demo_010%>%
filter(age=="TOTAL",
sex=="T",
time%in%c(2008,2022))%>%
select(geo,time,sex,values)yth08_20%>%dimdata <- yth08_20%>%
inner_join(eu_geo, by = "geo") %>%
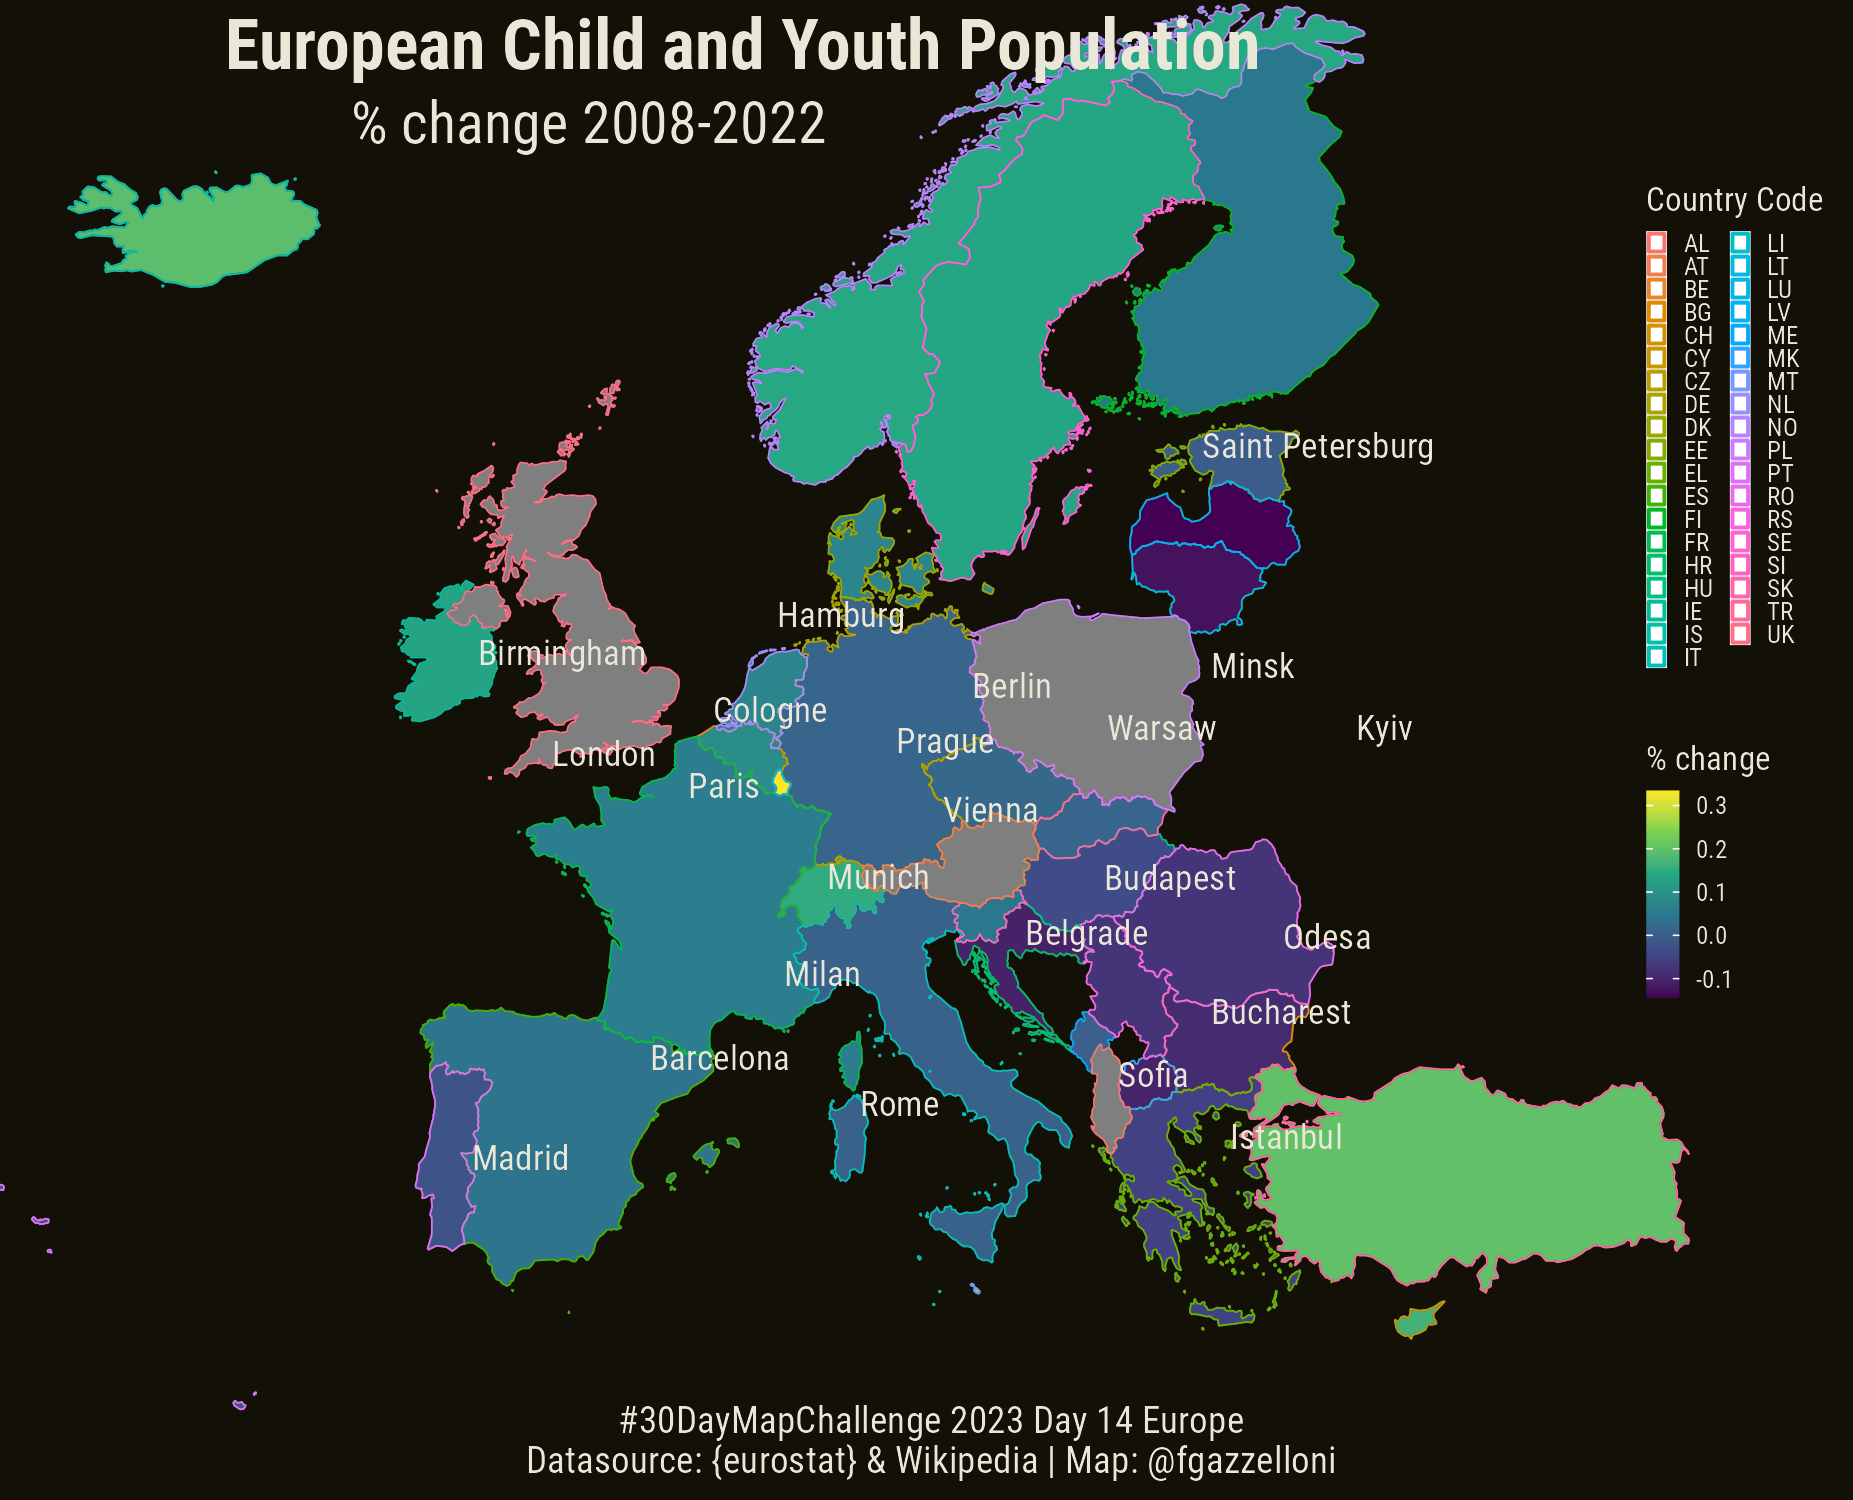
st_as_sf()Precentage of Change in Youths (2008-2022)
ydata <- data%>%
  janitor::clean_names()%>%
  mutate(name_latn=str_to_title(name_latn))%>%
  select(geo,geometry,sex,time,values,name_latn)%>%
  pivot_wider(names_from = "time",values_from = "values",names_prefix = "Y")%>%
  mutate(change=round((as.numeric(Y2022)-as.numeric(Y2008))/as.numeric(Y2008),3))

ydata
European Cities
eu_cities <- read_html("https://en.wikipedia.org/wiki/List_of_European_cities_by_population_within_city_limits")

eu_cities <- eu_cities%>%
  html_nodes("table") %>%
  .[[1]] %>%
  html_table(fill = TRUE)

eu_cities<- eu_cities[,-1]
eu_cities %>% names()eu_cities<- eu_cities %>%
mutate(City=str_replace_all(City, "\\[.*\\]",""))%>%
select(City,Country)city.geo <- geocode(eu_cities$City)
eu_cities <- cbind(eu_cities,city.geo)ggplot(ydata)+
geom_sf(aes(fill=change),inherit.aes = F)+
geom_sf(aes(color=geo),fill=NA,alpha=0.5)+
ggrepel::geom_text_repel(data=eu_cities,
aes(x=lon,y=lat,label=City),
size=3,color="#ebe7d8",
family="Roboto Condensed",
inherit.aes = F)+
scale_x_continuous(limits = c(-10, 35)) +
scale_y_continuous(limits = c(35, 65)) +
scale_fill_continuous(type = "viridis",
name = "% change",
guide = guide_colorbar(
direction = "vertical",
title.position = "top",
label.position = "right",
barwidth = unit(8, "pt"),
barheight = unit(50, "pt"),
ticks = TRUE))+
coord_sf(clip = "off")+
labs(color="Country Code",
title="European Child and Youth Population",
subtitle = "% change 2008-2022",
caption="#30DayMapChallenge 2023 Day 14 Europe\nDatasource: {eurostat} & Wikipedia | Map: @fgazzelloni")+
ggthemes::theme_map()+
theme(text=element_text(size=14,color="#ebe7d8",family="Roboto Condensed"),
plot.title = element_text(face="bold",hjust = -1),
plot.caption = element_text(hjust = 0.5,size=9),
legend.background = element_blank(),
legend.position = c(1.1,0.3),
legend.title = element_text(size=8),
legend.text = element_text(size=6),
legend.key.size = unit(5,units = "pt"))ggsave("day14_europe.png",height = 5,bg="#121007")