install.packages("spatstat")Overview
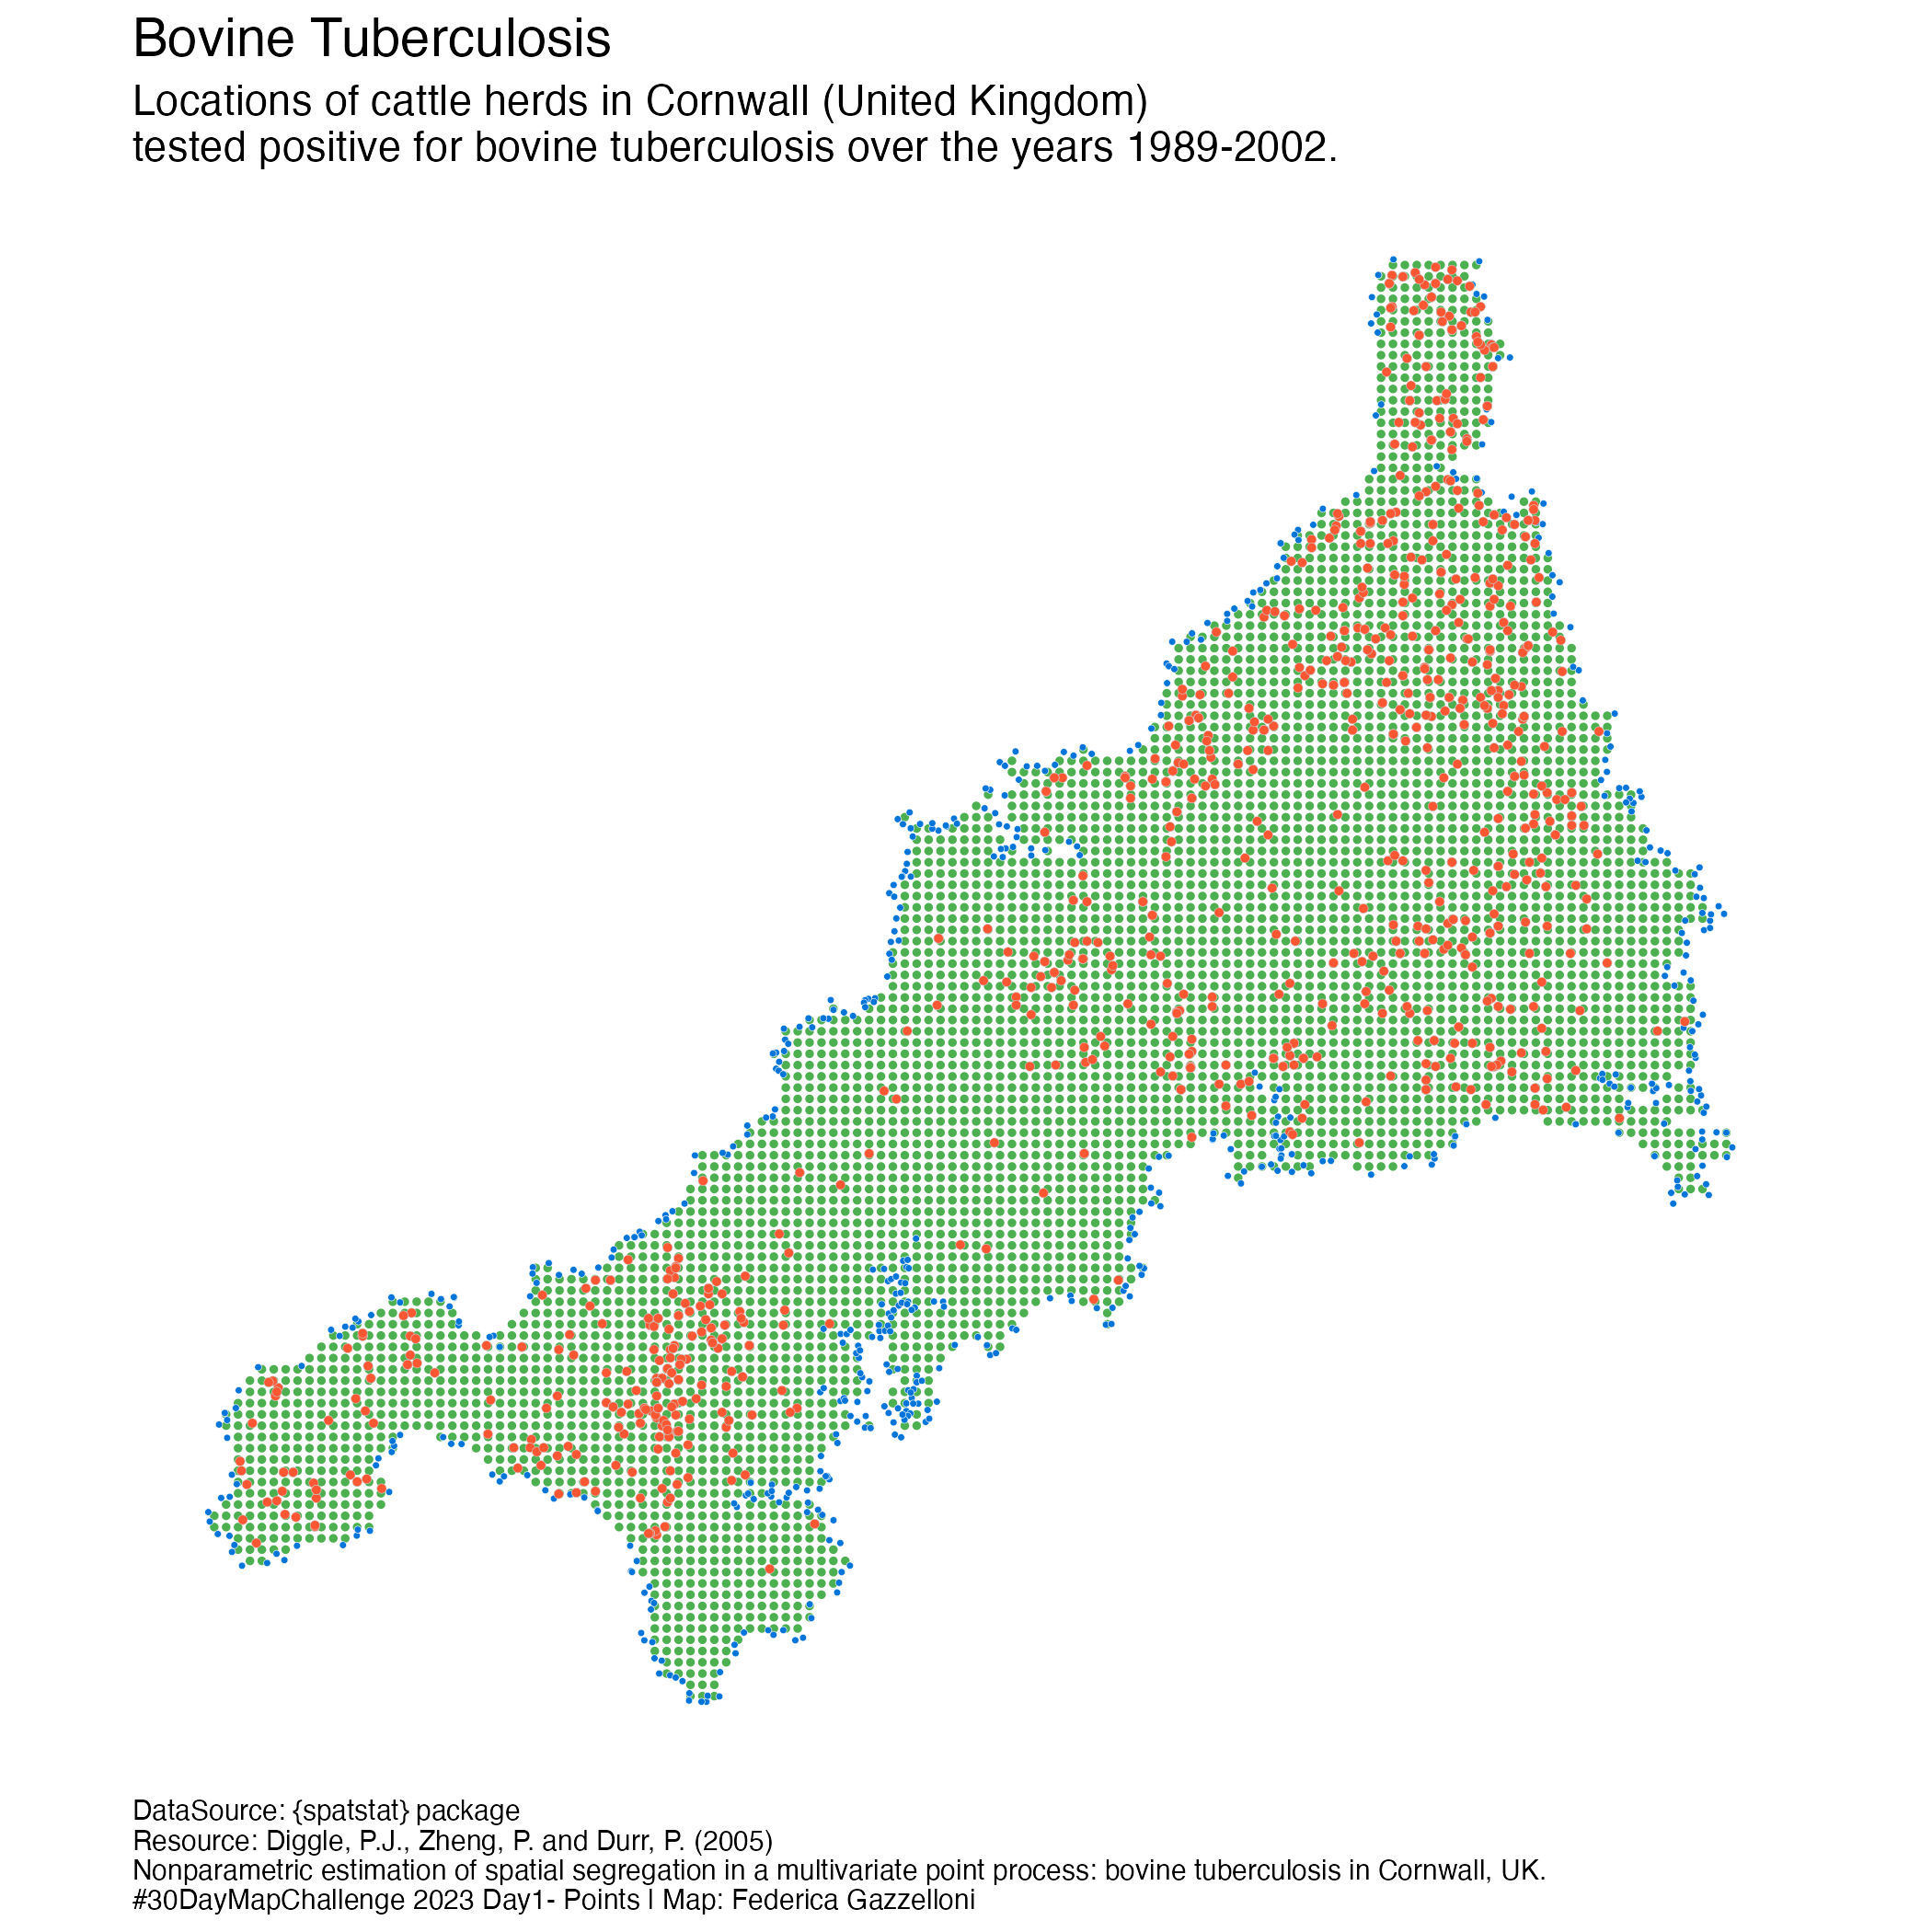
A points map of the Bovine Tubercoulosis Farm Locations in Cornwall, UK (South West England). Data is from the {spatstat} package.
Let’s have a look at the {spatstat} package for spatial point patterns usage:
Load necessary libraries:
library(tidyverse)
library(spatstat)
For this challenge I’ll have a look at the Bovine Tuberculosis dataset from the {spatstat} package.
A geospatial data of 873 farm locations with detected bovine tuberculosis in Cornwall, UK, over the years 1989-2002.
?btbspatstat.data::btbLocations of cattle herds in Cornwall (United Kingdom) that have tested positive for bovine tuberculosis in the observation region, which is the polygon of Cornwall, annotated with marks including the year of testing, and spoligotype (a qualitative genetic marker).
data(btb)summary(btb)summary(btb)
plot(subset(btb, select=spoligotype), cols=2:5)borders <- tibble(lon = btb$window$bdry[[1]]$x,
lat = btb$window$bdry[[1]]$y)
dat <- tibble(lon=btb$x,
lat=btb$y)
ggplot()+
geom_point(data=borders,
aes(lon,lat),
size=0.1) +
geom_point(data=dat,
aes(lon,lat))+
labs(title="Farm Locations")Compute the Kernel densities using the density() function, and specify the bandwidth parameter sigma with the cross-validation by function bw.diggle.
den <- density(btb, sigma = bw.diggle)
plot(den)
description <- data.frame(text="Locations of cattle herds in Cornwall (United Kingdom)\ntested positive for bovine tuberculosis over the years 1989-2002.",
caption="\nResource: Diggle, P.J., Zheng, P. and Durr, P. (2005)\nNonparametric estimation of spatial segregation in a multivariate point process: bovine tuberculosis in Cornwall, UK.\n#30DayMapChallenge 2023 Day1- Points | Map: Federica Gazzelloni")library(stars)
st_as_stars(den)%>%
st_as_sf(as_points = TRUE)%>%
ggplot()+
geom_sf(size=0.4,color="#4CAF50")+
geom_point(data=borders,
aes(lon,lat),
size=0.8,
shape=21,
stroke=0.1,
color="#FFFFFF",
fill="#0074D9") +
geom_point(data=dat,
aes(lon,lat),
shape=21,
stroke=0.1,
color="#CCCCCC",
fill="#FF5733",
size=1.1)+
labs(title="Bovine Tuberculosis",
subtitle=description$text,
caption=paste("DataSource: {spatstat} package",description$caption))+
ggthemes::theme_map()+
theme(plot.background = element_rect(colour = "#FFFFFF",fill="#FFFFFF"),
panel.background = element_rect(colour = "#FFFFFF",fill="#FFFFFF"),
plot.title = element_text(size = 14),
plot.subtitle = element_text(size=11),
plot.caption = element_text(hjust = 0))ggsave("day1_points.png")