library(tidyverse)
library(sf)
library(osmdata)
library(showtext)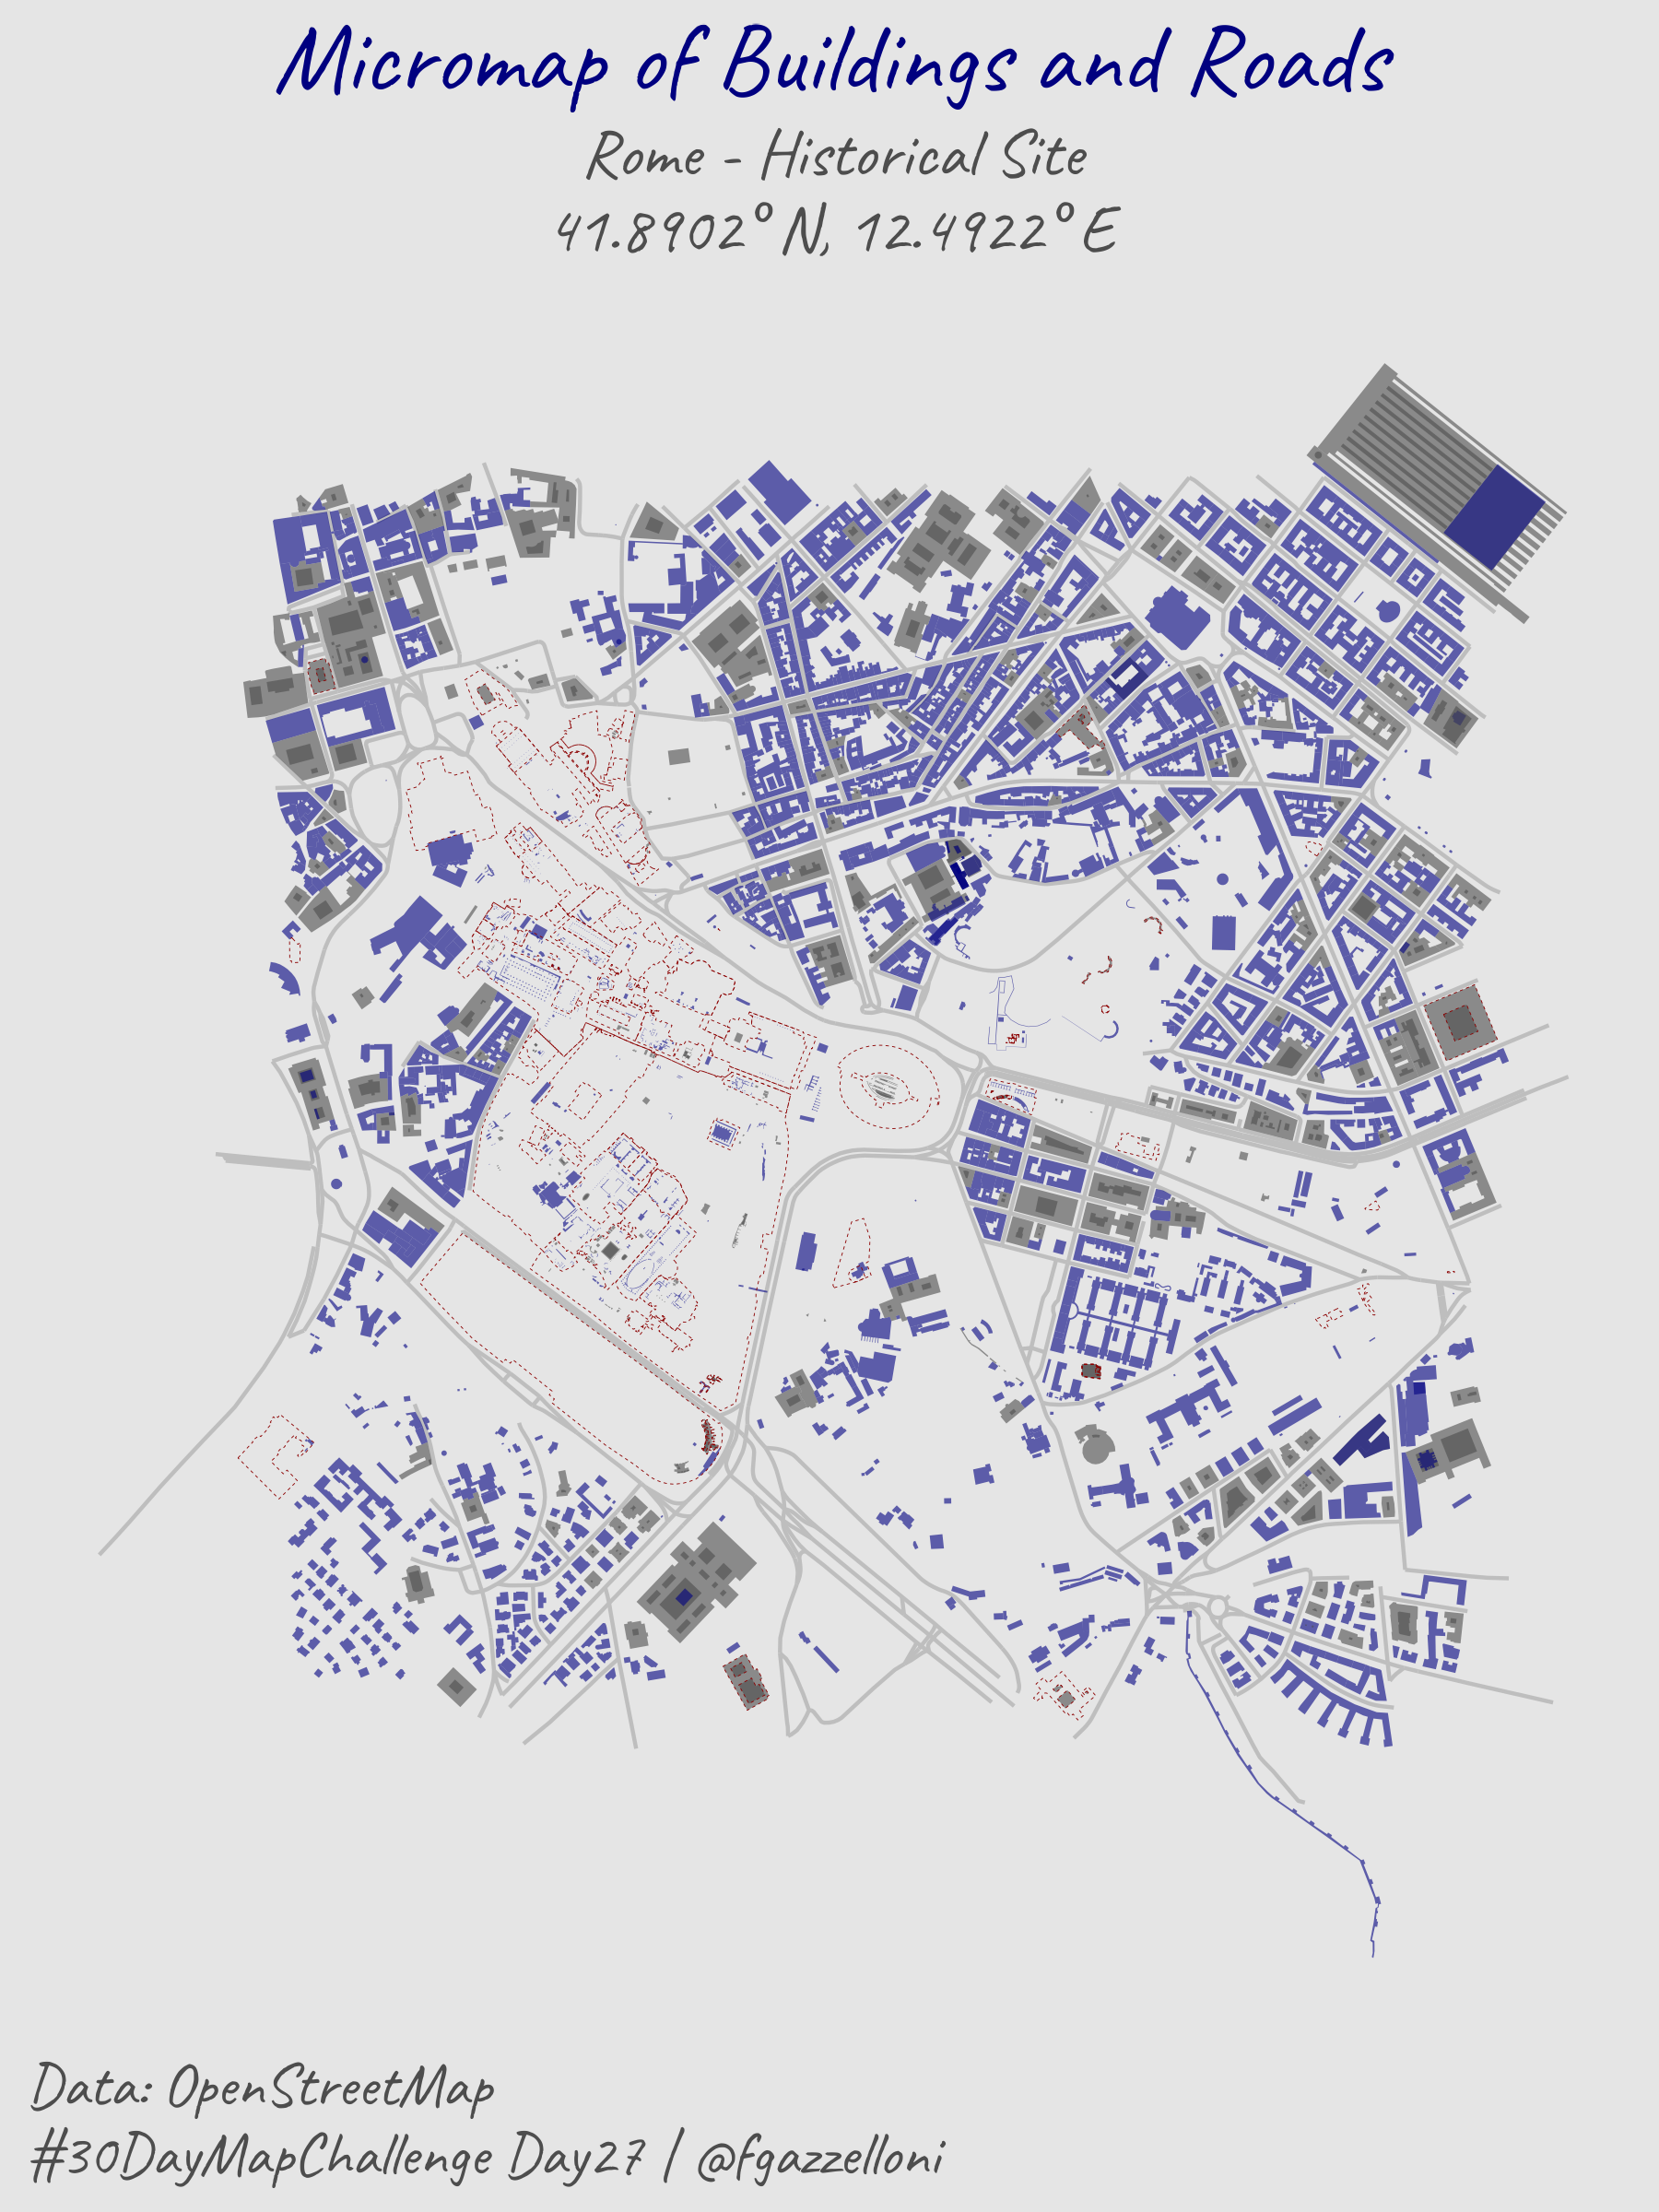
Load Libraries
Set the View Point: Rome - Colosseum
Coordinates 41.8902° N, 12.4922° E
long = 12.4922
lat = 41.8902
window <- st_point(c(long, lat)) %>%
st_sfc(crs = 4326) %>%
st_sf() %>%
st_buffer(dist = 1000) %>%
st_bbox()
windowosmdata::available_features()Download the Buildings / Features Data for the Area of Interest:
building <- opq(window) %>%
  add_osm_feature(key = "building") %>%
  osmdata_sf()

lanes <- opq(window) %>%
  add_osm_feature(key = "lanes") %>%
  osmdata_sf()

historic <- opq(window) %>%
  add_osm_feature(key = "historic") %>%
  osmdata_sf()
building_polygons <- building$osm_polygons
lanes_linestrings <- lanes$osm_lines
historic_polygons <- historic$osm_multipolygonsbuilding_polygons%>%
count(building, sort = TRUE)lanes_linestrings%>%
count(lanes, sort = TRUE)historic_polygons%>%
count(historic, sort = TRUE)plot(historic_polygons)polygons_mod <- building_polygons %>%
mutate(building = ifelse(!is.na(building), 'Buildings', "Other")) Set the fonts:
font_add_google(name = 'Caveat', family = 'Caveat')
showtext_auto()
# Micromap focusing on a small neighborhood
ggplot() +
geom_sf(data = lanes_linestrings,
color = "gray") +
geom_sf(data = polygons_mod,
aes(fill = building),
linejoin = "round",
show.legend = F,
color = NA,
alpha = 0.6) +
geom_sf(data = historic_polygons,
color = "darkred",
linewidth = 0.1,
linetype = "dashed",
fill = NA,
alpha = 0.6) +
scale_fill_manual(values = c('navy','grey30')) +
coord_sf() +
labs(title = "Micromap of Buildings and Roads",
subtitle = "Rome - Historical Site\n41.8902° N, 12.4922° E",
caption = "Data: OpenStreetMap\n#30DayMapChallenge Day27 | @fgazzelloni",
x = "Longitude", y = "Latitude") +
ggthemes::theme_map() +
theme(text = element_text(family = 'Caveat', lineheight = 0.3),
plot.title = element_text(color = 'navy',
size = 80,
hjust = 0.5),
plot.subtitle = element_text(color = 'gray30',
size = 55,
hjust = 0.5),
plot.caption = element_text(color = 'gray30',
size = 50,
hjust = 0),
plot.background = element_rect(fill = 'grey90',
color = NA))Save the map as png:
ggsave('day27_micromapping.png',
       height = 8, width = 6,
       dpi = 300)