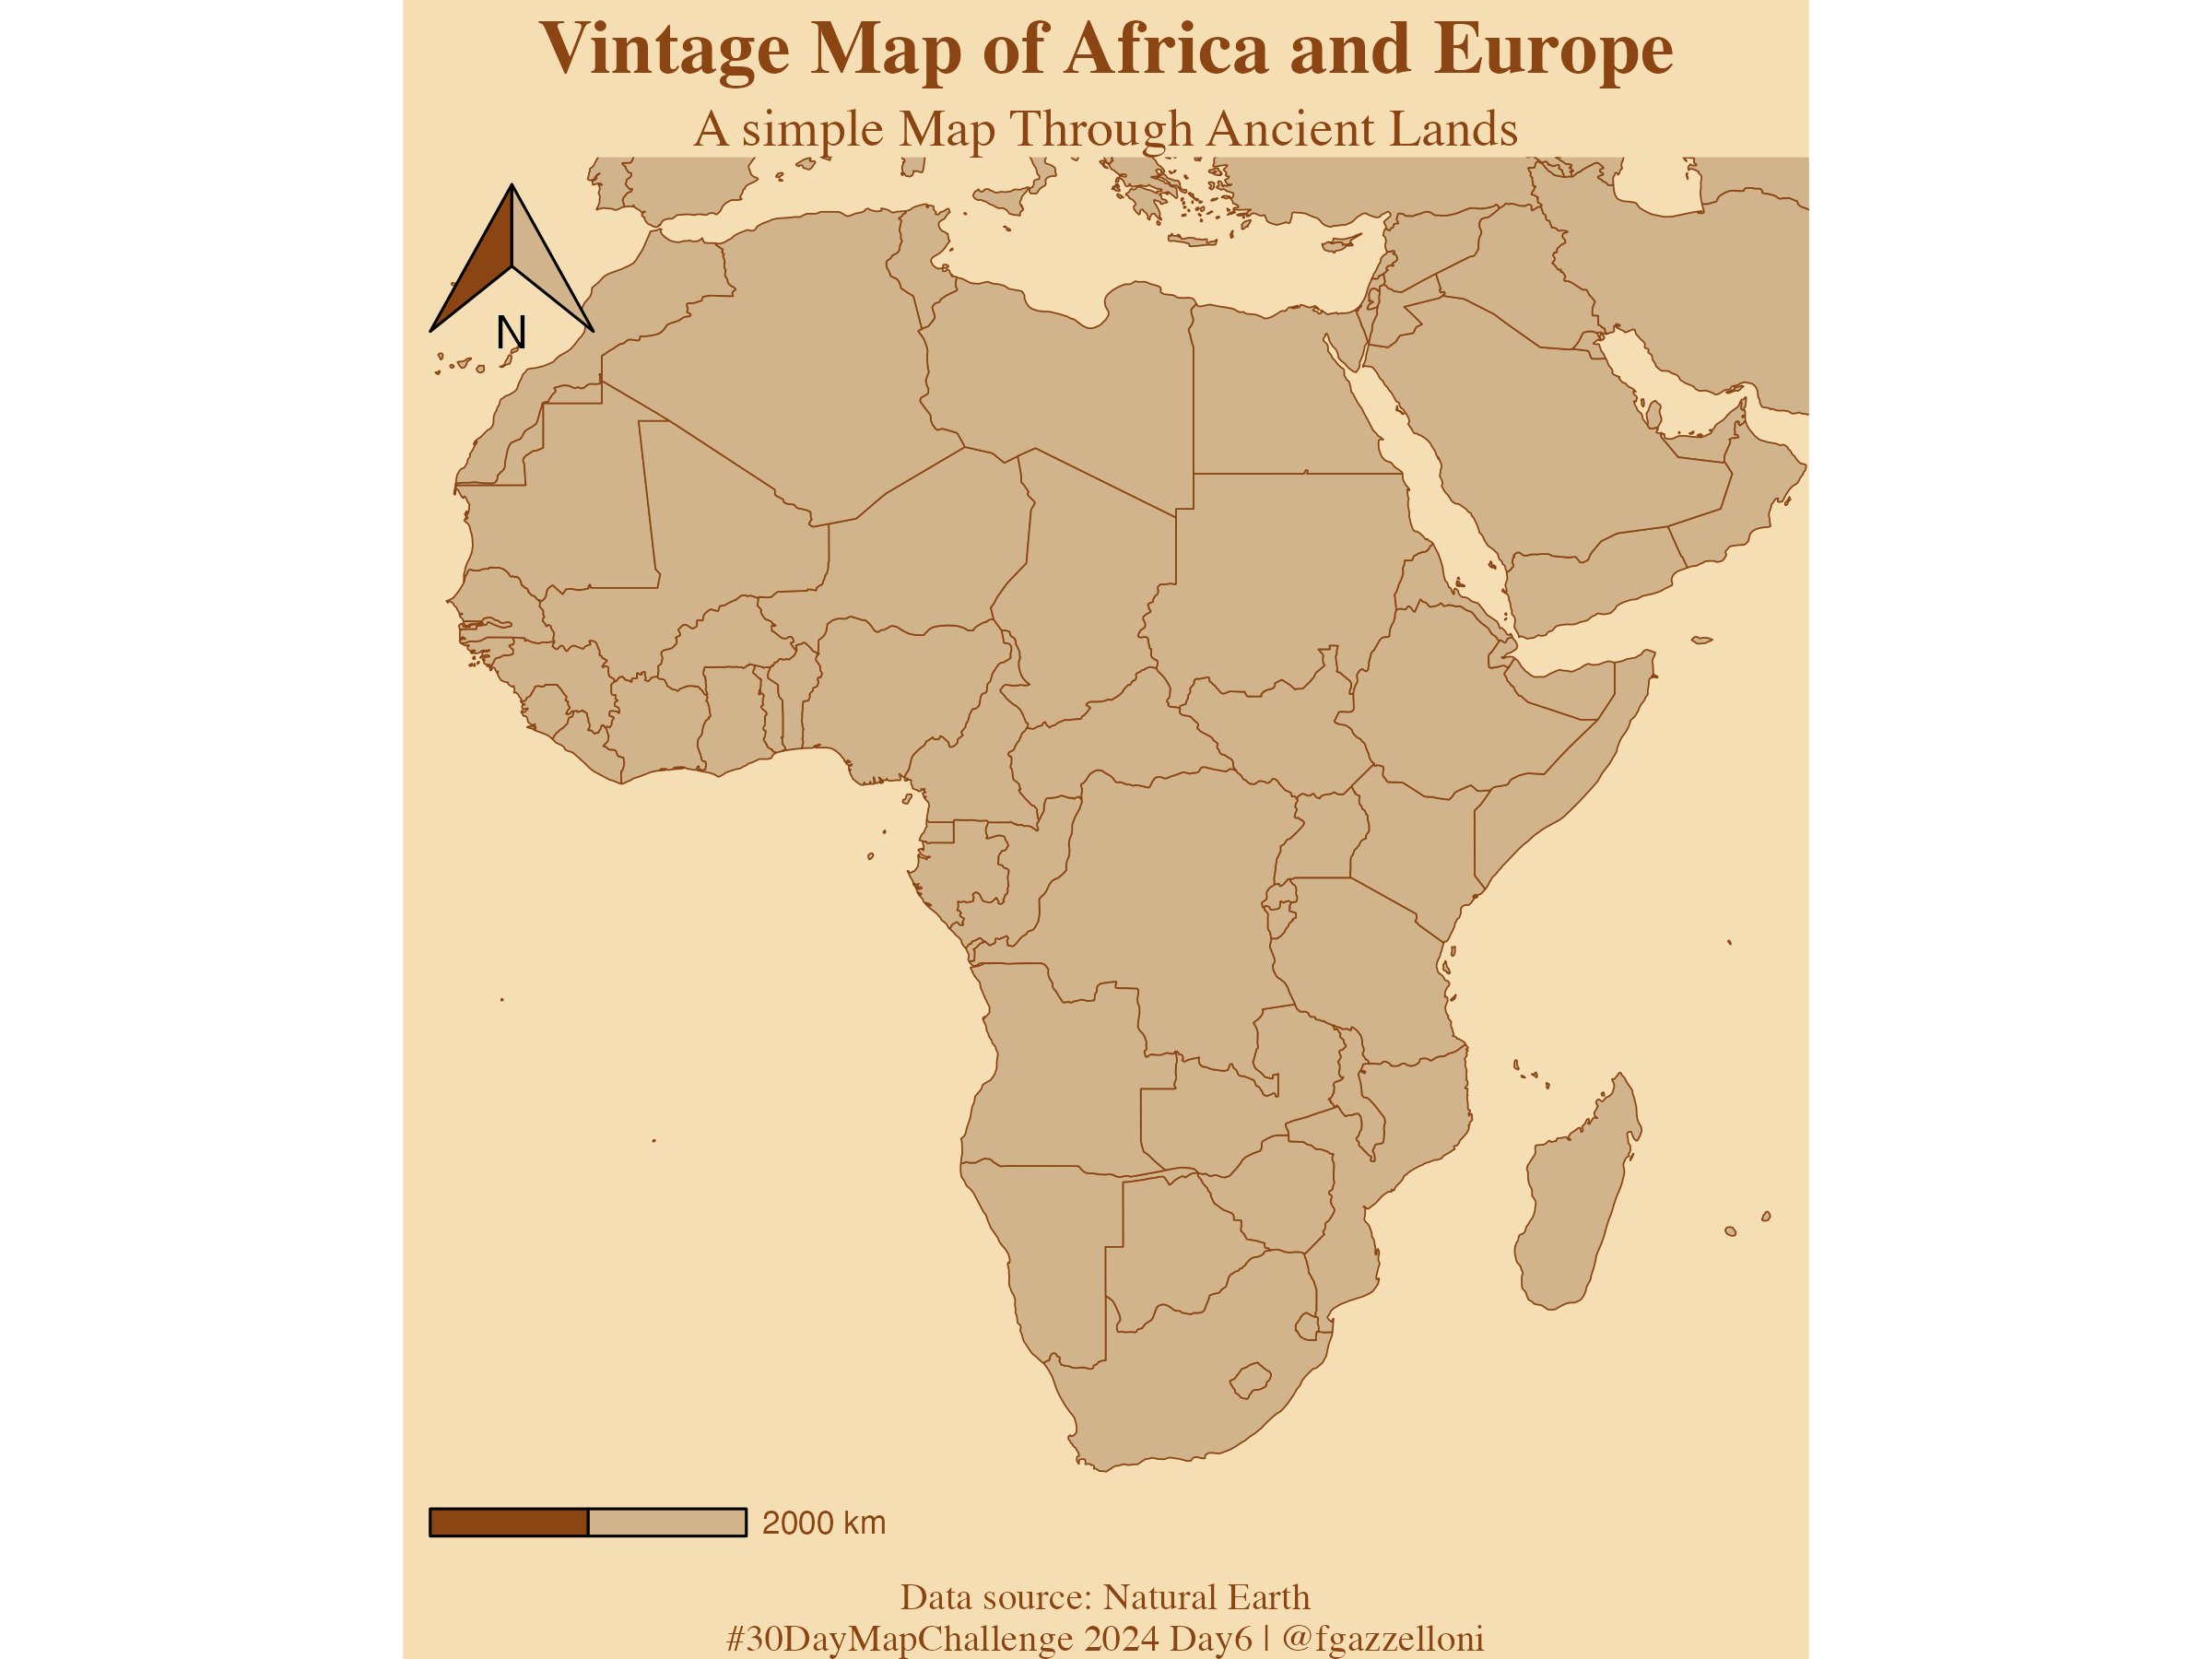
library(sf)
library(ggplot2)
library(rnaturalearth)
library(ggspatial) Load the required libraries and data
# Load the world map data
world <- ne_countries(scale = "medium", returnclass = "sf")
# Plot the vintage map
ggplot(data = world) +
geom_sf(fill = "#D2B48C", color = "#8B4513", size = 0.2) + # Sepia tones
coord_sf(xlim = c(-20, 60), ylim = c(-40, 40), expand = FALSE) + # Limit to show specific area
labs(
title = "Vintage Map of Africa and Europe",
subtitle = "A simple Map Through Ancient Lands",
caption = "Data source: Natural Earth\n#30DayMapChallenge 2024 Day6 | @fgazzelloni") +
theme_void() + # Remove modern elements
theme(
plot.background = element_rect(fill = "#F5DEB3", color = NA), # Old paper background
plot.title = element_text(family = "serif", size = 20, face = "bold", color = "#8B4513", hjust = 0.5),
plot.subtitle = element_text(family = "serif", size = 14, color = "#8B4513", hjust = 0.5),
plot.caption = element_text(family = "serif", size = 10, color = "#8B4513", hjust = 0.5),
panel.grid = element_blank() # Remove grid lines for a cleaner, vintage look
) +
# Optional: add scale bar and north arrow in a vintage style
ggspatial::annotation_scale(location = "bl", bar_cols = c("#8B4513", "#D2B48C"), text_col = "#8B4513") +
ggspatial::annotation_north_arrow(location = "tl", which_north = "true",
style = north_arrow_orienteering(fill = c("#8B4513", "#D2B48C")))Save the plot as a PNG file
ggsave("day7_vintage.png",
       bg = "transparent",
       width = 8, height = 6,
       dpi = 300)