# Install the hdxr package from GitHub
# remotes::install_gitlab("dickoa/rhdx")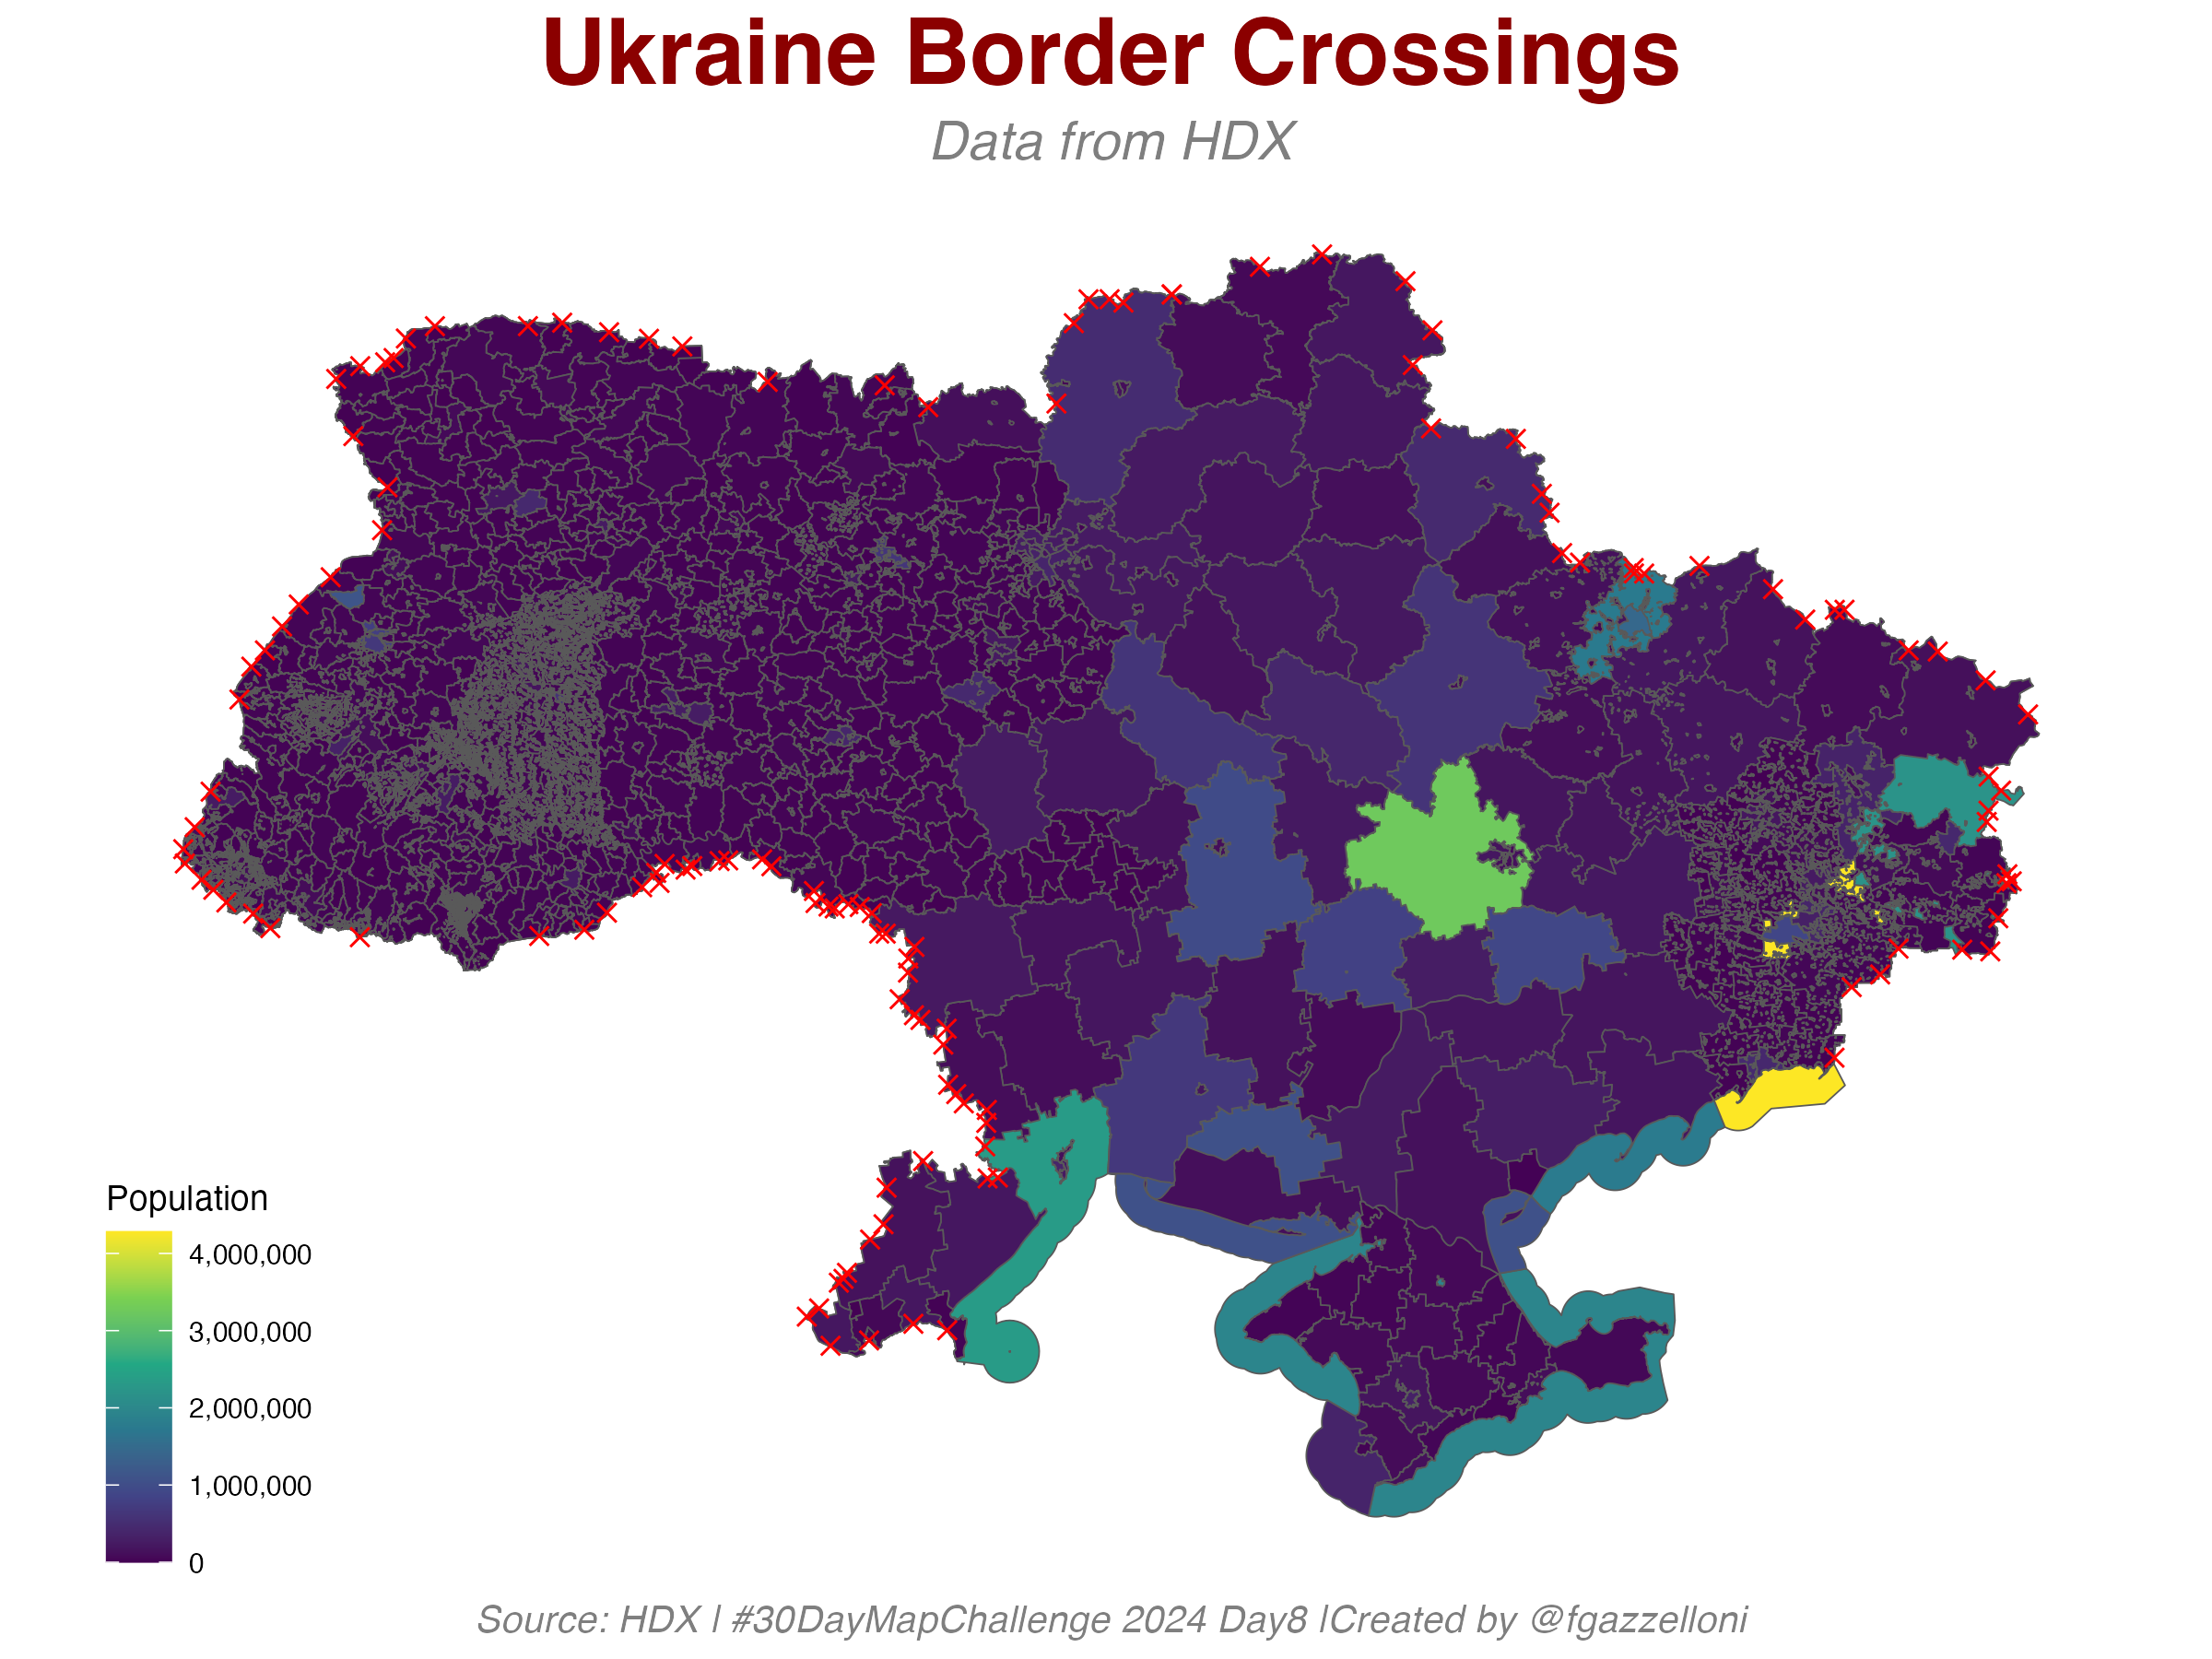 Load the required libraries and data
Set the HDX site to “prod” and check the configuration settings.
library(tidyverse)
library(rhdx)
set_rhdx_config(hdx_site = "prod")
get_rhdx_config()
Search for Ukraine data on HDX and list the datasets.
dat <- search_datasets("ukraine")
dat[2]
Select the second dataset and display the metadata: ukraine-border-crossings
border_crossing <- dat[2]Display the resources available in the dataset.
UKR_data <- border_crossing %>%
  nth(1) %>%
  get_resource(1) %>%
  read_resource()

UKR_data %>% head() %>% glimpse()
Search for Ukraine administrative boundaries data on HDX.
data2 <- search_datasets("Ukraine administrative boundaries")And select the first dataset and display the metadata: kontur-boundaries-ukraine
boundaries <- search_datasets("kontur-boundaries-ukraine")
boundaries[1]
kontur_boundaries_ukraine <- boundaries[1]resource <- kontur_boundaries_ukraine %>%
nth(1) %>%
get_resource(1)
resourceresource$get_format()file_path <- resource$download()
file_pathfile.info(file_path)$sizeUnzip the file
library(R.utils)
gunzip(file_path,
       destname = decompressed_file,
       overwrite = TRUE)
Read the shapefile
library(sf)
ukraine_boundaries <- sf::st_read(decompressed_file)ukraine_boundariesmap <- ggplot(ukraine_boundaries) +
geom_sf()
mapmap +
geom_sf(data = UKR_data,
shape = 4,
color="red",
size=2) +
ggthemes::theme_map() +
labs(title = "Ukraine Border Crossings",
subtitle = "Data from HDX",
caption = "Source: HDX | #30DayMapChallenge 2024 Day8 |Created by @fgazzelloni",
fill = "Population") ggplot(ukraine_boundaries) +
geom_sf(aes(fill = population)) +
geom_sf(data = UKR_data,
shape = 4,
color="red",
size=2) +
scale_fill_viridis_c() +
ggthemes::theme_map() +
labs(title = "Ukraine Border Crossings",
subtitle = "Data from HDX",
caption = "Source: HDX | #30DayMapChallenge 2024 Day8 |Created by @fgazzelloni",
fill = "Population") ggplot(ukraine_boundaries) +
geom_sf(aes(color = population)) +
geom_sf(data = UKR_data,
shape = 4,
color="red",
size=2) +
scale_color_gradient(low = "navy", high = "gold",) +
ggthemes::theme_map() +
labs(title = "Ukraine Border Crossings",
subtitle = "Data from HDX",
caption = "Source: HDX | #30DayMapChallenge 2024 Day8 |Created by @fgazzelloni",
fill = "Population") ukraine_boundaries%>%
count(admin_level)ukraine_boundaries%>%
count(name_en)ukraine_pop <- ukraine_boundaries%>%
group_by(name_en) %>%
reframe(geom,population = sum(population)) %>%
arrange(desc(population))
ukraine_popukraine_pop %>%
filter(name_en == "Ukraine") %>%
ggplot()+
geom_sf(aes(geometry=geom)) ukraine_pop %>%
filter(!name_en == "Ukraine") %>%
ggplot()+
geom_sf(aes(geometry=geom, fill = population)) ukraine_pop %>%
filter(!name_en == "Ukraine") %>%
ggplot()+
geom_sf(aes(geometry=geom,
fill = population,
color = population)) +
geom_sf(data = UKR_data,
shape = 4,
color="red",
size=2) +
ggthemes::theme_map() +
labs(title = "Ukraine Border Crossings",
subtitle = "Data from HDX",
caption = "Source: HDX | #30DayMapChallenge 2024 Day8 |Created by @fgazzelloni",
fill = "Population") +
scale_fill_viridis_c(
name = "Population",
labels = scales::label_comma(),
guide = "colourbar" # Show legend for 'fill'
) +
scale_color_viridis_c(
guide = "none" # Suppress legend for 'color'
) ukraine_boundaries %>%
filter(!name_en == "Ukraine") %>%
ggplot() +
geom_sf(aes(fill = population)) +
geom_sf(data = UKR_data,
shape = 4,
color="red",
size=2) +
scale_fill_viridis_c(name = "Population",
labels = scales::label_comma(),
guide = "colourbar") +
labs(title = "Ukraine Border Crossings",
subtitle = "Data from HDX",
caption = "Source: HDX | #30DayMapChallenge 2024 Day8 |Created by @fgazzelloni",
fill = "Population") +
ggthemes::theme_map() +
theme(
plot.title = element_text(
size = 24,
face = "bold",
color = "darkred",
hjust = 0.5),
plot.subtitle = element_text(
size = 14,
face = "italic",
color = "gray50",
hjust = 0.5)) ukraine_boundaries %>%
filter(!name_en == "Ukraine") %>%
ggplot() +
geom_sf(aes(fill = population)) +
geom_sf(data = UKR_data,
shape = 4,
color="red",
size=2) +
scale_fill_viridis_c(name = "Population",
labels = scales::label_comma(),
guide = "colourbar") +
labs(title = "Ukraine Border Crossings",
subtitle = "Data from HDX",
caption = "Source: HDX | #30DayMapChallenge 2024 Day8 |Created by @fgazzelloni",
fill = "Population") +
ggthemes::theme_map() +
theme(
plot.title = element_text(
size = 24,
face = "bold",
color = "darkred",
hjust = 0.5),
plot.subtitle = element_text(
size = 14,
face = "italic",
color = "gray50",
hjust = 0.5),
plot.caption = element_text(
size = 10,
face = "italic",
color = "gray50",
hjust = 0.5))Save the plot as a PNG file
ggsave("day8_hdx.png",
       bg = "white",
       width = 8, height = 6,
       dpi = 300)