Materials
View slides in full screen.
How to make Data visualizations
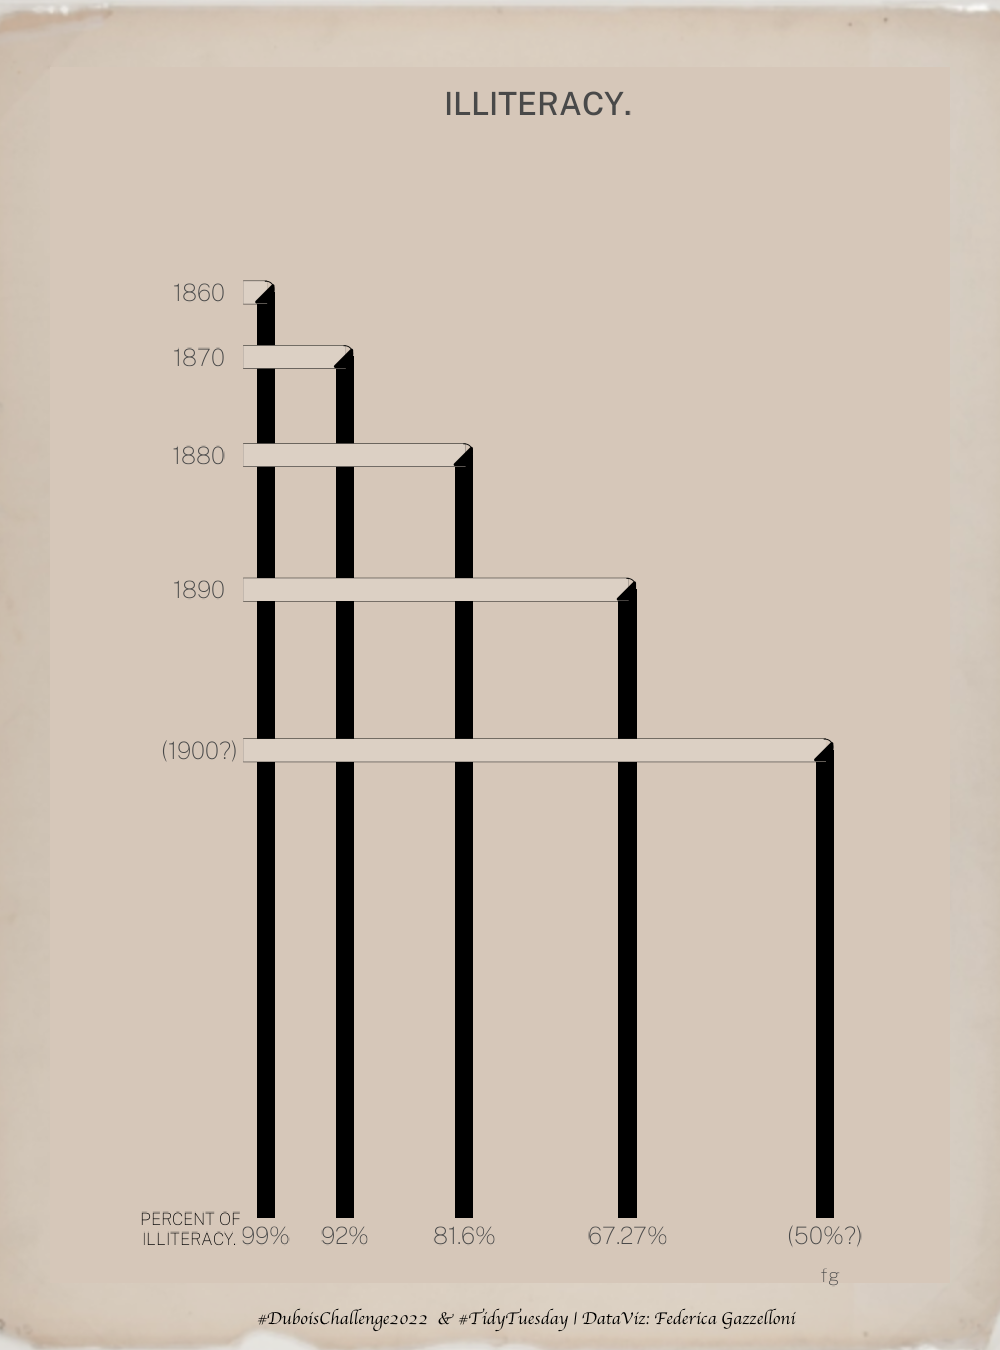
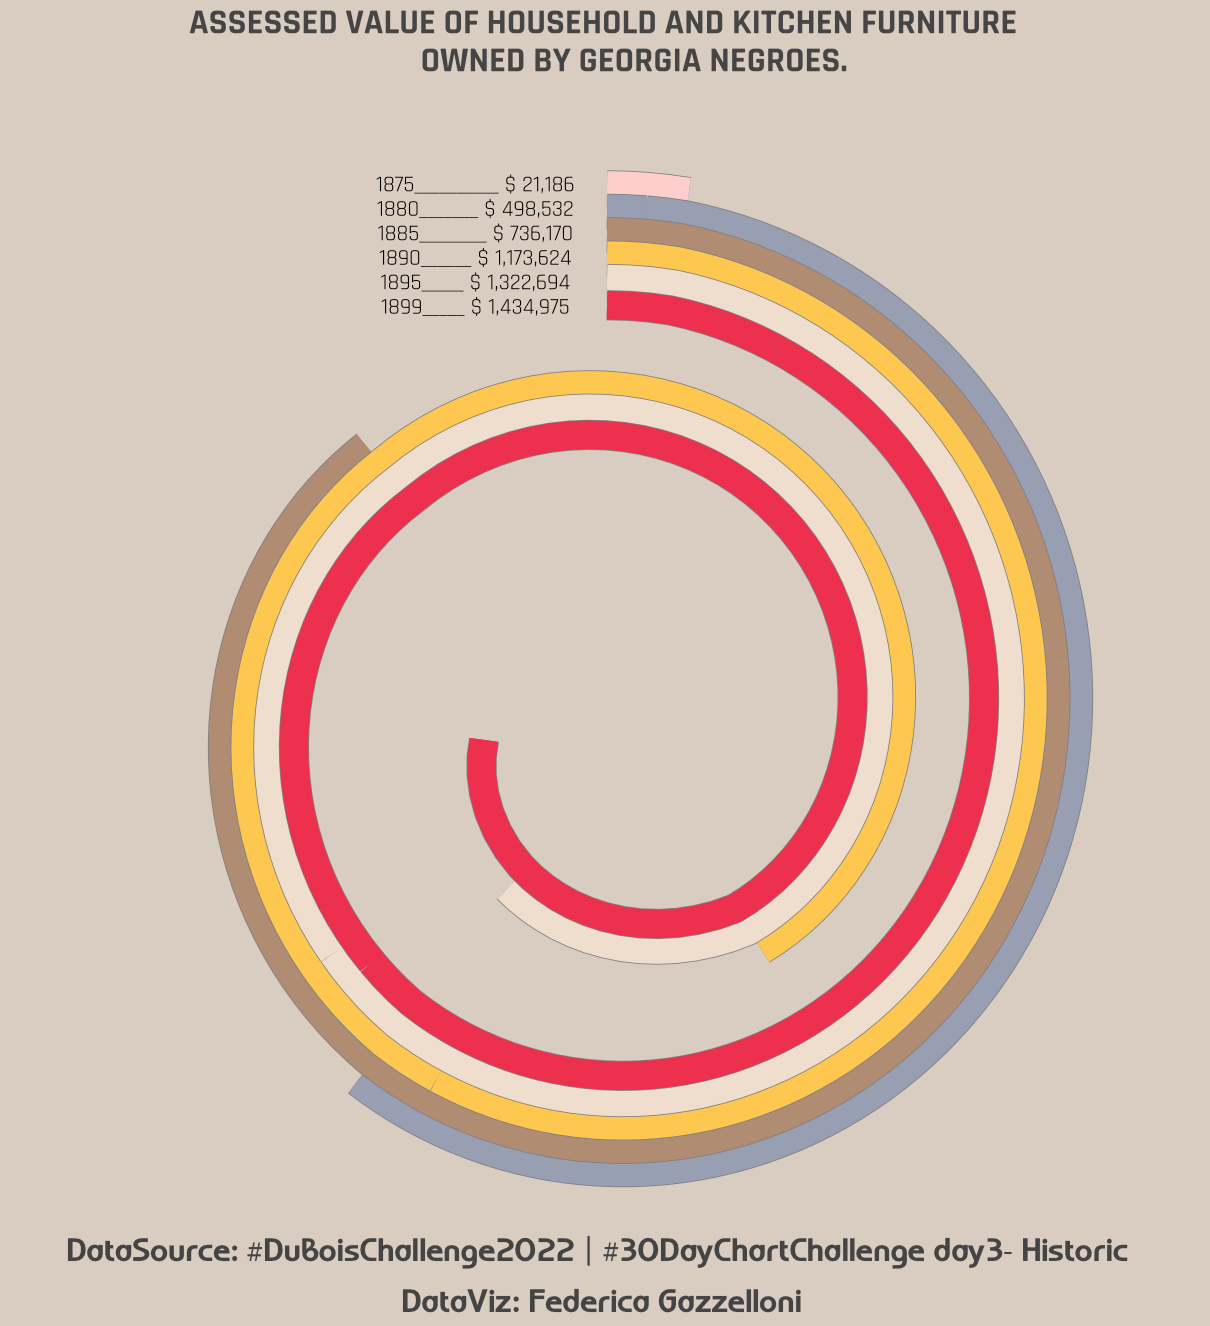
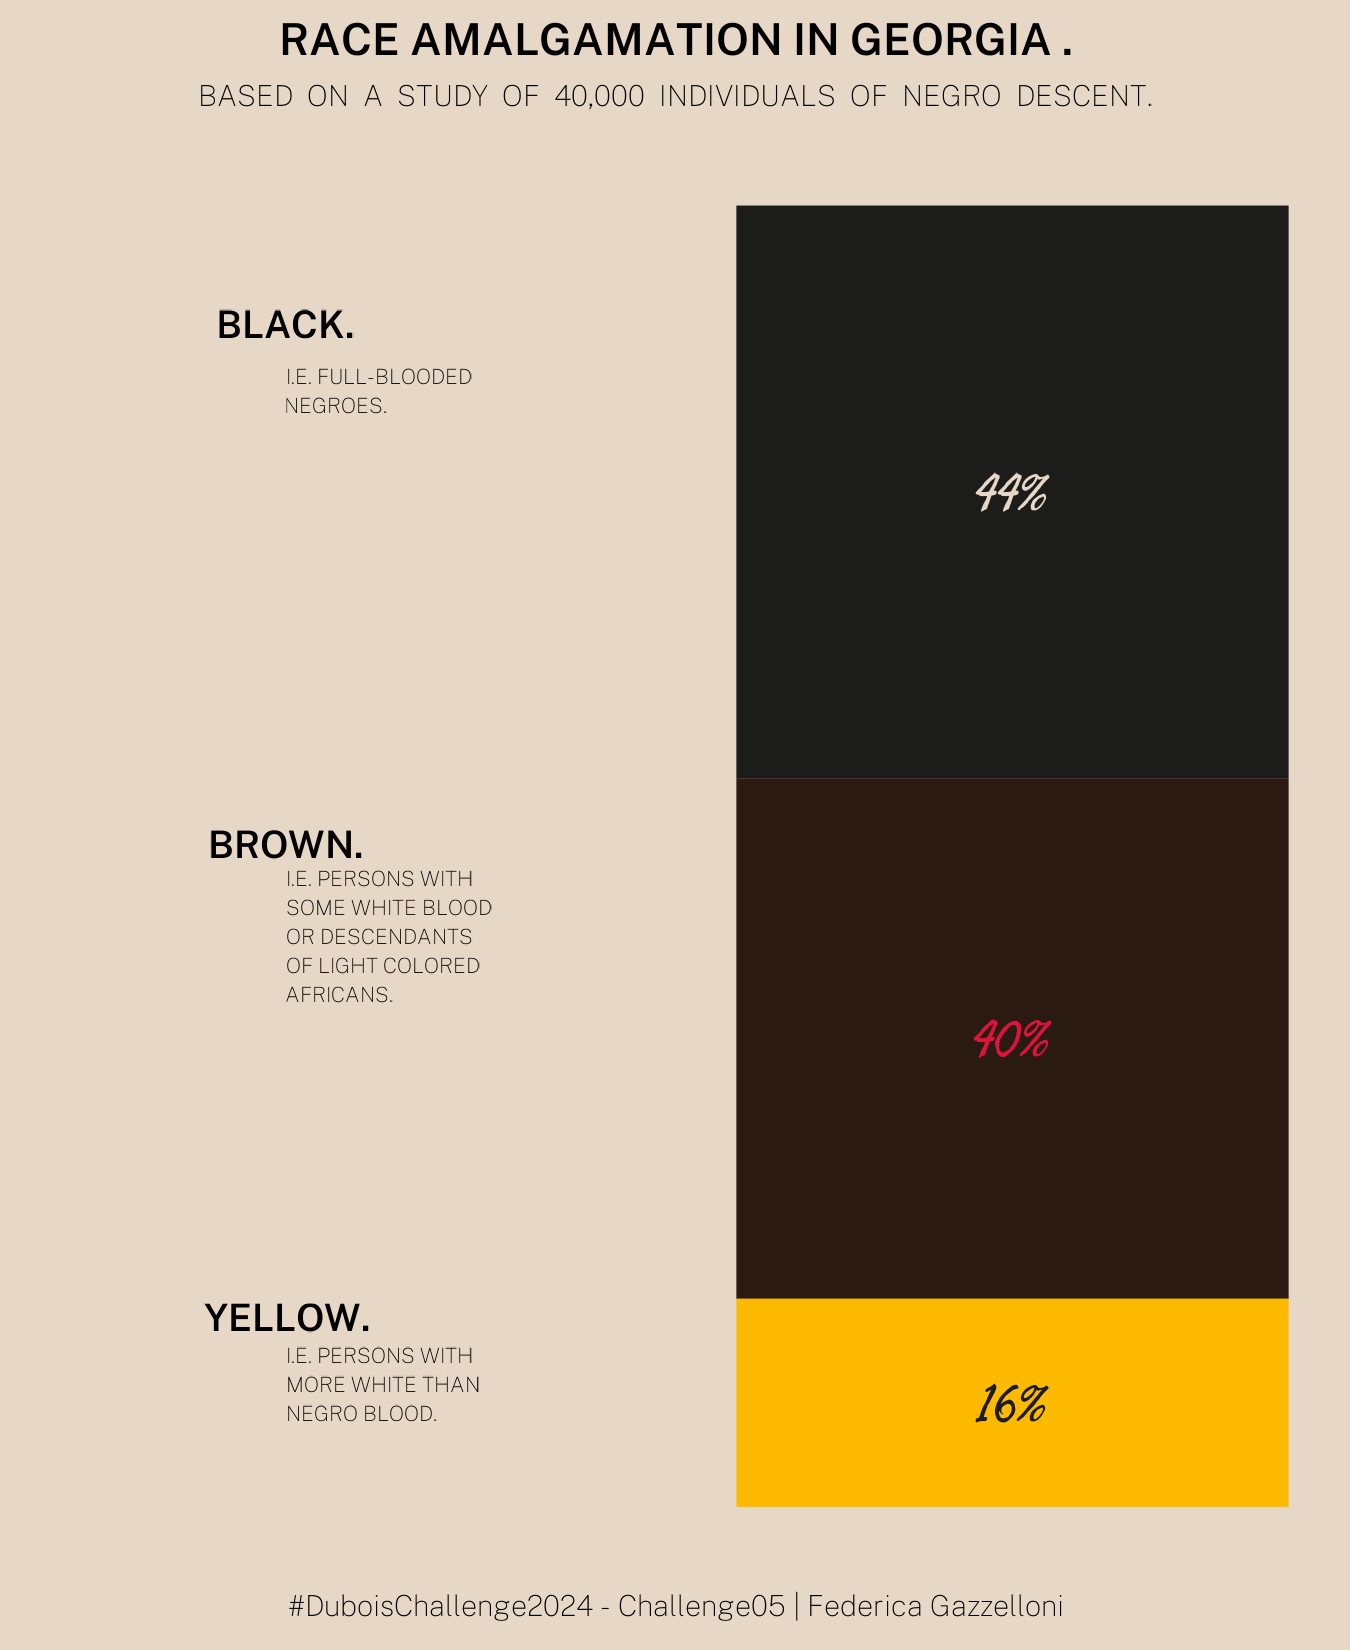
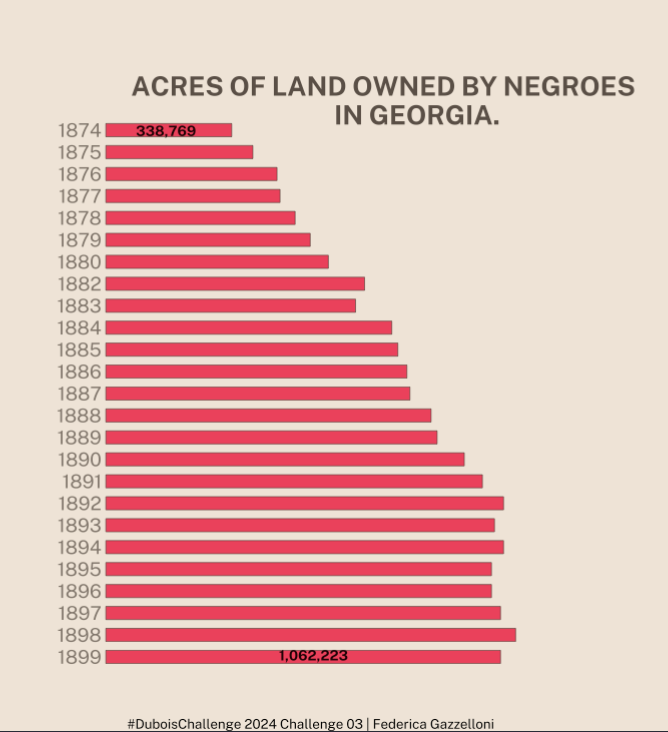
Here, I share a collection of charts that I’ve made using R. The project is called #DuBoisChallenge. It’s a creative journey that transforms numbers and information into eye-catching charts.
Explore this collection with me.